The EIA Answers Tuesday’s Question: 15.2 MMbbl Draw Sends WTI Back to 1
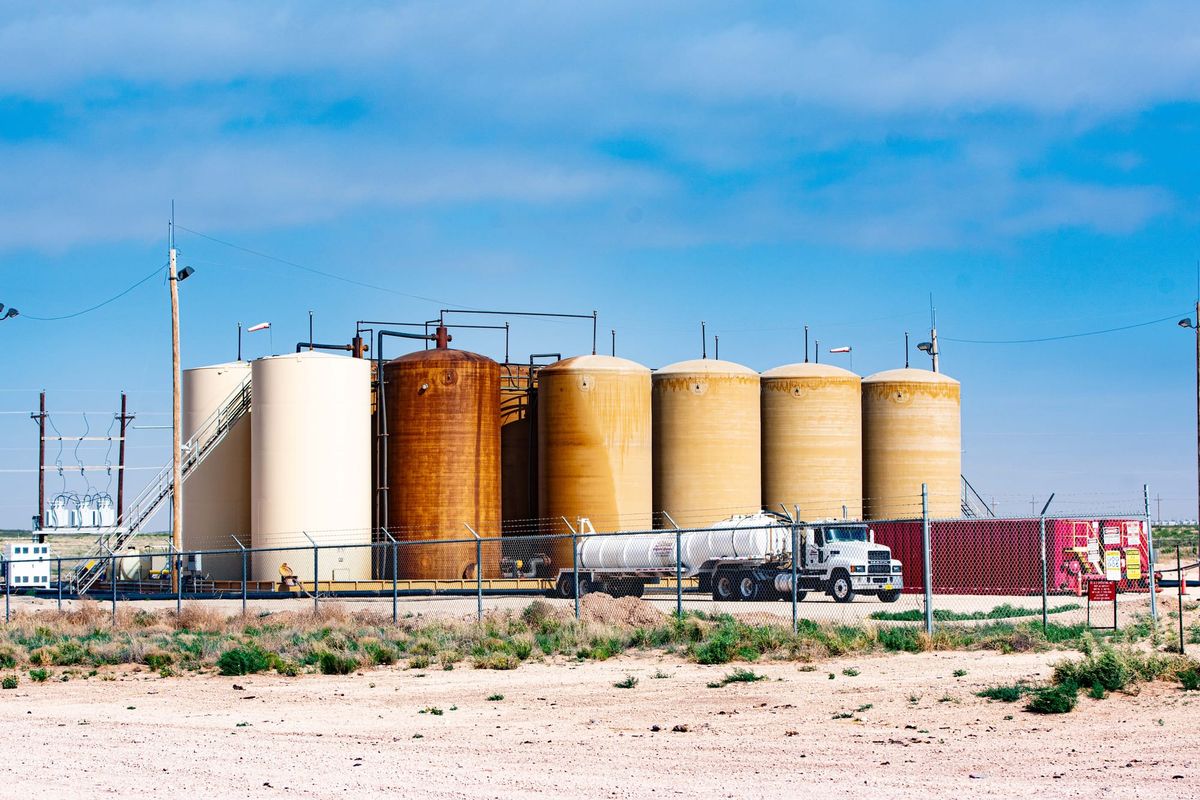
The EIA's Wednesday inventory report just changed the conversation. Crude stocks fell 15.2 MMbbl in the week ending June 5 — the ninth consecutive draw, the largest single-week drop since March, and enough to send WTI up $2.88 to $91.08 by afternoon close. The numbers were unambiguous: 775,677 Mbbl total stocks, down from 790,831 the prior week, now sitting roughly 7% below the five-year seasonal average.
WTI had closed Tuesday at $88.20, after OPEC+'s fourth consecutive July hike sent the market lower. Wednesday's EIA print reversed that entirely. The session opened flat, then accelerated after the 10:30am ET inventory release. By 3:45pm CT, WTI had printed $91.08 — a 3.27% single-day gain, well past the 2% flag threshold. Brent tracked the move, settling at $94.00 (+2.79%). Henry Hub held $3.10, a modest gain on the week.
Why This Draw Is Different
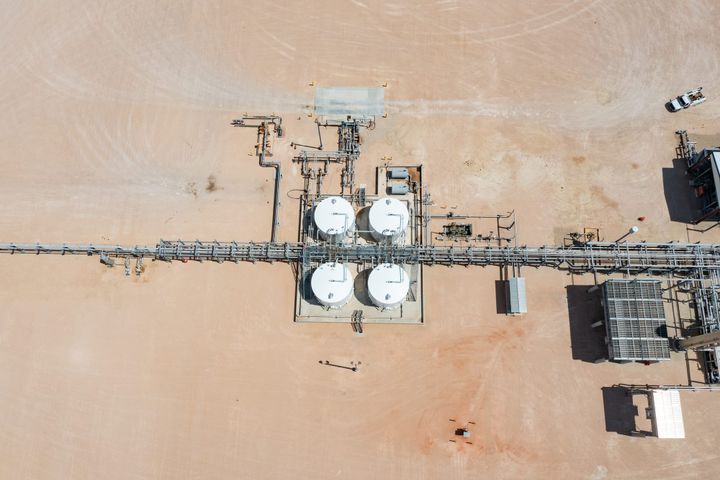
Nine consecutive weeks of crude draws isn't just a seasonal story. The aggregate since the April 3 peak stands at 102.4 MMbbl — roughly 11.4 MMbbl per week. That's a draw rate that would be notable in any price environment, but at $88-91 WTI, it carries a different signal: refiners are running hard, exports are staying elevated, and Hormuz-constrained supply hasn't rebuilt the way bulls hoped. The inventory buffer that a ceasefire or deal was supposed to provide simply hasn't shown up in the data.
CIR Analysis: This is the market correcting Tuesday's pessimism. The OPEC+ hike added 188K bpd on paper; the EIA data shows the physical market pulling in the opposite direction. Operators reading both numbers have more clarity today than they had yesterday — WTI's floor is not $88, it's wherever the draw rate says it is.
The RBL Clock
Wednesday's close lands at a specific moment in the capital markets calendar. Spring RBL redeterminations are running through June, and lender price decks were typically set against $85-90 strip assumptions. A $91 close — the second time in two weeks the market has tested above that range on genuine data rather than geopolitical noise — starts to shift the fall redetermination math. The most leveraged borrowers in the Permian and Eagle Ford aren't disadvantaged at $91; they're looking at borrowing base headroom that didn't exist at $87.
That's the nuance today's move carries. Monday's OPEC+ decision was a volume signal. Wednesday's EIA is a demand signal. They point in different directions, and the market chose the demand signal.
SLB's June 17 Signal
One EDGAR filing landed today without much fanfare: SLB (Item 7.01) announced its 2026 Digital Investors Day, scheduled for June 17 in New York. CEO Olivier Le Peuch and CFO Stephane Biguet will present. The event itself is routine — SLB's annual tech showcase. But the timing matters. Any guidance commentary on North America activity levels, digital platform bookings, or the ChampionX integration will arrive one week from today, at a price level ($91 WTI) that's materially better than where SLB's Q1 call was held in April. CIR Analysis: Watch for updated NA utilization commentary. The bifurcation thesis — international holding, North America soft — was the story in Q1. A $91 floor resets that question for Q2.
What Thursday's Open Depends On
WTI closed $91.08. The next catalyst is binary: Thursday morning either builds on today's inventory confidence or another geopolitical headline reverses it. The Iran deal framework is still the primary overhang — every session that passes without a deal confirmation is a session where the physical market keeps drawing. The June 11 EIA storage report (natural gas) arrives Thursday; HH at $3.10 has been resilient, and a gas draw above seasonal norms would reinforce the energy-broad tightening narrative that supported today's crude move.
CIR Analysis: $91 is now the second time this week that the market has been asked whether sub-$90 is the new normal. Tuesday said yes. Wednesday said no. Friday's close will tell us which answer is sticking.
Crude Intelligence Report is an independent upstream oil and gas intelligence publication. The content in this article is for informational purposes only and does not constitute investment advice, financial advice, or a recommendation to buy or sell any security. Always conduct your own due diligence before making investment decisions. CIR and its contributors may hold positions in companies mentioned; any such positions will be disclosed when known. © 2026 Crude Intelligence Report. All rights reserved.
This article contains forward-looking statements and analytical opinions. Actual results may differ materially.