Permian Basin Oil Production Outlook 2026: Midland vs. Delaware, Growth Ceiling, and What Operators Are Watching
The Permian Basin Oil Production Outlook in 2026: Growth, Constraints, and What Comes Next
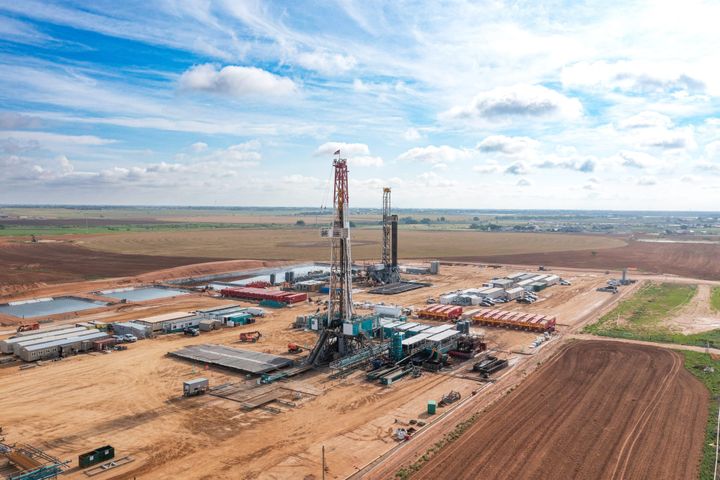
The Permian Basin oil production outlook in 2026 is running ahead of expectations. Texas field production hit 5,806 Mbbl/d in February 2026, up from 5,560 Mbbl/d in January, according to EIA data. New Mexico's side of the basin — predominantly the Delaware sub-basin — added another 2,308 Mbbl/d in February after a weather-related dip to 2,118 Mbbl/d in January. Combined, the Permian is operating at roughly 7,000-7,500 Mbbl/d, depending on how you allocate non-Permian Texas production, making it the single most consequential hydrocarbon province in the world today.
That growth trajectory isn't accidental. It reflects deliberate operator strategy built on years of efficiency gains — longer laterals, more frac stages per well, improved completion design — layered on top of major consolidation moves that concentrated acreage into fewer, better-capitalized hands.
Midland vs. Delaware: A Permian Basin Oil Production Outlook by Sub-Basin
The Permian Basin is not a monolith. Two distinct sub-basins drive the numbers — the Midland Basin on the eastern side and the Delaware Basin stretching across West Texas and southeastern New Mexico — and they are on different trajectories in 2026.
The Midland Basin is the more mature acreage. Pioneer Natural Resources (now ExxonMobil) and Diamondback Energy hold the dominant footprints. Well productivity in the core Midland has remained high, but the inventory of Tier 1 locations is finite. Operators are still delivering strong results, but the runway for peak productivity is getting shorter. ExxonMobil's XTO subsidiary is running a large program from the Pioneer acquisition, and Diamondback reported Q1 2026 production of 521 Mboe/d with a guidance raise, validating that the basin's core inventory still delivers at current prices.
The Delaware Basin is where the growth vector points. New Mexico crude production growth reflects Delaware activity: 2,287 Mbbl/d in July 2025, rising to 2,348 Mbbl/d by October, then compressed to 2,118 Mbbl/d in January 2026 on winter weather, and recovering sharply to 2,308 Mbbl/d in February. That January drop was a weather artifact, not a supply signal.
The Devon-Coterra merger, which closed in May 2026, created the largest Delaware Basin operator by acreage. The combined entity holds overlapping positions across Reeves, Eddy, and Lea counties that gives them scale to optimize well spacing and water infrastructure across a contiguous block.
What $109 WTI Means for the Permian Production Outlook
At $109.76/bbl WTI, almost every Permian operator is printing free cash flow. The question shifts from whether to invest to how aggressively.
The industry's answer in 2026 has been disciplined, not aggressive. The major public operators — XOM, CVX, DVN-CTRA, FANG, PR — have maintained or modestly raised capital guidance without blowing out activity. Private operators, who don't face the same capital allocation scrutiny, have been more willing to add rigs.
CIR Analysis: The Permian rig count has held relatively flat in the 300-310 range over the first half of 2026 despite oil prices well above consensus planning assumptions. This is a structural shift from the pre-2020 era, when operators chased price with activity. Boards and CFOs have internalized capital discipline. The production growth you're seeing is not from more rigs — it's from better wells on existing rig counts.
Infrastructure Constraints: The Ceiling on the Permian Production Outlook
Production growth without takeaway capacity is a margin problem, not just a volume problem. The Permian Basin learned this the hard way in 2018-2019, when Waha basis blew out to negative territory as gas pipeline capacity lagged oil production growth. Crude takeaway hit similar stress points.
The picture is meaningfully better in 2026 on crude, though not without tension:
- Crude pipelines: Matterhorn Express Pipeline (2.5 Bcf/d natural gas) came online in late 2024, significantly relieving natural gas takeaway pressure. On crude, the Wink-to-Webster and Epic Crude pipelines added capacity in recent years, and current crude pipeline utilization is high but not constrained at current production rates.
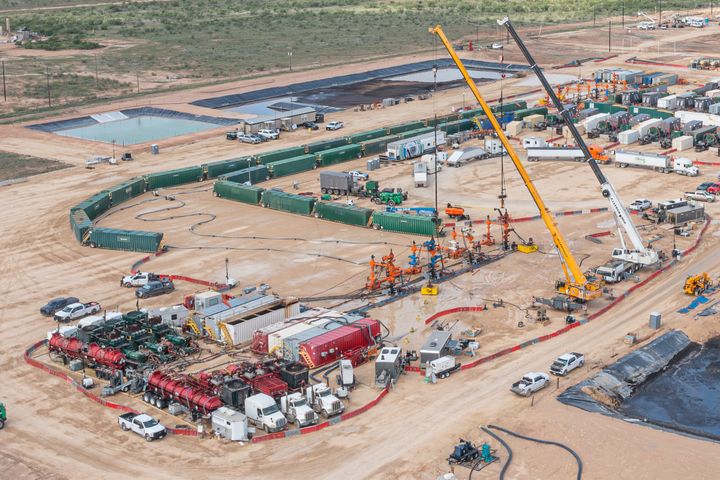
- Water management: Produced water volumes are growing faster than oil production in many Delaware Basin formations. Water disposal and recycling infrastructure is a rate-of-growth limiter — not a production stopper, but a cost escalator.
- Gas flaring and emissions: Federal permitting pressure and state RRC oversight in Texas have kept operators focused on minimizing flaring. Gas capture rates have improved, but incremental production in gassier formations requires sanctioned takeaway before wells can produce at full rates.
EIA's US Production Forecast: Where the Permian Fits
EIA's Short-Term Energy Outlook projects total US crude production reaching 13.83 Mbbl/d by December 2026 and 14.28 Mbbl/d by December 2027, according to EIA STEO data. That's up from 13.24 Mbbl/d in January 2026 — roughly 1 Mbbl/d of growth over two years at the national level.
The Permian is the engine of virtually all of it. The Bakken rig count continues to drift lower as operators consolidate. Eagle Ford growth is moderate. Appalachian gas growth is strong, but that's a different commodity. The incremental barrel in US crude production in 2026 is, with overwhelming probability, a Permian barrel.
That concentration carries a systemic risk: any material weather event, regulatory action, pipeline disruption, or operator strategy shift in the Permian has outsized implications for global supply.
The Inventory Question: How Long Can the Permian Sustain This?
Basin-wide inventory estimates vary widely depending on assumptions about technology improvement, well spacing, and acceptable economic thresholds. The honest answer is that the Permian has more inventory than bears have been willing to credit for the past decade.
CIR Analysis: Operators have systematically extended their runway through longer laterals (now routinely 15,000-17,000 feet in the best Delaware wells), child-well management improvements, and co-development of stacked pay intervals. What looked like a 10-year inventory in 2018 looks like a 15-20 year inventory today in many core positions — but not indefinitely.
Drilled-but-uncompleted (DUC) wells remain a key swing factor. The Permian still holds one of the largest DUC inventories among US basins, providing a buffer between rig activity and actual production. When operators want to accelerate production without adding rigs, they draw down DUCs. When they want to bank inventory, they drill without completing. As of the EIA's most recent Drilling Productivity Report data, the Permian DUC drawdown has been gradual — not a signal of supply desperation, but steady management of the backlog.
For a detailed look at DUC inventories across all major US basins, see: DUC Wells by Basin 2026: Inventory Tracker and Production Implications.
Key Operators Shaping the 2026 Outlook
A handful of operators disproportionately determine the Permian basin oil production outlook:
- ExxonMobil (XOM): The Pioneer acquisition made XOM the single largest Permian operator. Their production data, capital deployment, and well productivity are now consequential at the basin level.
- Chevron (CVX): Large Delaware Basin position. Running a steady program with strong free cash flow generation.
- Devon-Coterra (DVN): Combined Delaware Basin giant. Integration will drive well cost improvements and operational efficiency through H2 2026 and into 2027.
- Diamondback Energy (FANG): The most capital-efficient pure-play Permian operator by most cost metrics. Q1 2026 production of 521 Mboe/d at $12.50/boe cash operating costs — the lowest in the basin among major operators.
- Permian Resources (PR): Reached investment-grade credit status in early 2026, with Q1 production of 343 Mboe/d and $513M in free cash flow. A pure-play Delaware Basin story.
For the week-by-week rig count picture and sub-basin breakdown, CIR tracks the data here: Permian Basin Rig Count 2026: Weekly Tracker, Midland vs. Delaware, and Production Implications.
What To Watch for the Rest of 2026
- Devon-Coterra integration milestones: If the combined entity executes on synergy targets of $375M+, it sets a template for further consolidation and signals that the Delaware Basin's capital efficiency runway is longer than bears think.
- EIA Monthly DPR updates: The Drilling Productivity Report is the highest-frequency public data on Permian production trends. Any acceleration or deceleration in new-well oil production per rig is the earliest leading indicator of the production trajectory.
- Takeaway expansion announcements: Any additional crude or gas pipeline capacity announced for the Permian constrains or expands the production ceiling over the 2027-2028 timeframe.
- Price deck shifts: At $109 WTI, capital discipline holds. If WTI moves materially lower, watch whether operators use DUC drawdowns to sustain production or cut activity and let the numbers roll off.
- Water regulatory actions: New Mexico's ongoing produced water disposal regulations are a background risk for Delaware Basin operators. Cost escalation from tightening disposal rules is a margin story that doesn't show up in production data — until it does.
Crude Intelligence Report is an independent upstream oil and gas intelligence publication. The content in this article is for informational purposes only and does not constitute investment advice, financial advice, or a recommendation to buy or sell any security. Always conduct your own due diligence before making investment decisions. CIR and its contributors may hold positions in companies mentioned; any such positions will be disclosed when known. © 2026 Crude Intelligence Report. All rights reserved.
This article contains forward-looking statements and analytical opinions. Actual results may differ materially.