DUC Wells by Basin 2026: Inventory Tracker and Production Implications
What Are DUC Wells?
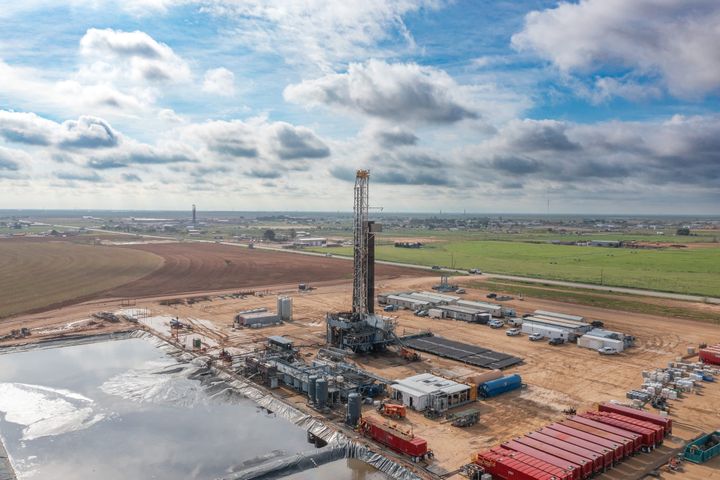
A drilled-but-uncompleted well is exactly what it sounds like: the wellbore has been drilled to total depth, casing has been run, and the hole is ready for hydraulic fracturing — but the completion work hasn't happened yet. The well sits in inventory, representing capital already spent but production not yet earned.
The DUC count matters because it functions as a short-cycle production reserve. When operators want to accelerate output quickly — in response to a price spike, contractual obligations, or balance sheet needs — they can pull from DUC inventory rather than wait 60–120 days for a new well to reach the same stage. Conversely, when operators are capital-constrained or prices are soft, DUC counts swell as drilling outpaces completion activity.
According to EIA's Drilling Productivity Report, the national DUC inventory peaked at roughly 8,900 wells in mid-2020 during the COVID-era rig collapse. Since then, operators have systematically worked down that inventory through a period of completions outpacing new drilling. Understanding the current DUC wells by basin in 2026 tells you a lot about where production growth is coming from — and where it isn't.
DUC Wells by Basin in 2026: The Current Inventory
EIA's most recent Drilling Productivity Report data shows the national DUC count continuing the structural decline that began in 2021. The basin-level picture reveals meaningful divergence in operator strategy across plays:
Permian Basin (Midland + Delaware): ~893 DUC wells | Appalachia: ~824 | Anadarko: ~701 | Haynesville: ~791 | Niobrara (DJ Basin): ~628 | Eagle Ford: ~345 | Bakken: ~328
Source: EIA Drilling Productivity Report. Note: DUC counts reflect EIA estimates from the most recent DPR release.
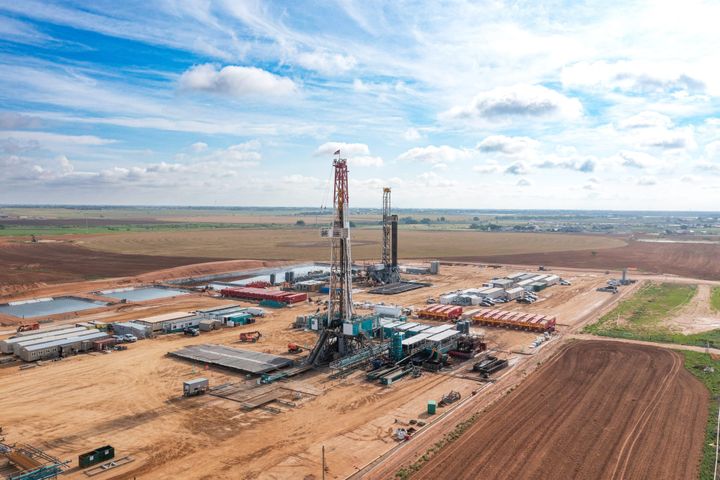
The Permian leads all basins in raw DUC inventory, which makes sense — it also runs the most active rig count. At around 300–310 rigs in early 2026, the Permian generates new drilled wellbores faster than any other basin. The DUC count there is less a sign of idled completion capacity and more a function of scale: the queue of wells waiting for completion crews is larger simply because the drilling program is larger.
The Permian: Completions Engine, Not Backlog Problem
The Permian's ~893 DUC wells do not represent stranded inventory. The basin's completion crews — the frac spreads, wireline units, and coil tubing operations that turn drilled holes into producing wells — have been running near full capacity through the $100 WTI environment that has characterized 2026. CIR Analysis: at current WTI levels (approximately $100/bbl as of early May 2026), every Permian DUC has positive NPV to complete immediately. There is no economic rationale for Permian operators to sit on this inventory.
The practical constraint is operational: there are only so many frac crews. The Permian's DUC count is therefore a scheduling queue, not a hesitancy signal. Production from the basin has continued rising, reaching approximately 6.2 MMbbl/d in mid-2025 per EIA production data, and the DUC inventory replenishes continuously as drilling activity adds new wells faster than completions absorb them.
Within the Permian, the split between Midland Basin and Delaware Basin DUC inventory reflects each sub-basin's development stage. The Delaware is running deeper, longer-lateral wells with higher per-well capital requirements — which slightly extends the drilling-to-completion timeline compared to shallower Midland targets. Operators like Diamondback, Coterra (post-Devon merger), and OXY are the primary movers of Permian DUC inventory.
Appalachia and Haynesville: Gas DUCs at an LNG Inflection Point
Two gas basins — Appalachia (~824 DUCs) and Haynesville (~791 DUCs) — hold the second and third largest DUC inventories nationally. The dynamics here differ meaningfully from the Permian's price-driven completions pace.
Appalachian DUC inventory has been building modestly as gas producers have maintained drilling programs to hold acreage and position for the LNG demand wave, while deliberately managing completion timing against a Henry Hub price that has been range-bound in the $2.50–$4.00/MMBtu zone. At $2.72/MMBtu (FRED, late April 2026), Appalachian gas economics are tighter than Permian crude economics, giving operators reason to pace their completion activity.
Haynesville shows similar dynamics with an important wrinkle: the basin's proximity to Gulf Coast LNG export terminals means Haynesville producers often access LNG basis-linked pricing that exceeds Henry Hub. Expand Energy (EXE), the dominant Haynesville operator post-CHK merger, has been explicit in its strategy of maintaining a completion backlog that can be accelerated quickly when LNG offtake volumes increase. CIR Analysis: the Haynesville DUC inventory functions more like a deliberate liquidity reserve than a backlog problem — operators are positioning for the 2026–2027 LNG capacity additions that will structurally lift Gulf Coast gas demand.
Eagle Ford and Bakken: Tighter DUC Inventories Signal Maturation
The Eagle Ford (~345 DUCs) and Bakken (~328 DUCs) carry the tightest inventories of any major oil-weighted basin. This is a maturation story. Both plays have seen sustained completion activity working through legacy DUC backlog, and both face the geological reality that the best drilling locations have already been targeted.
For the Eagle Ford, the thin DUC count means production growth from new completions is increasingly dependent on active drilling to replenish the queue. ConocoPhillips — the largest Eagle Ford operator post-Marathon acquisition — has been disciplined about maintaining an Eagle Ford rig program that keeps completions activity steady rather than lumpy.
The Bakken's ~328 DUCs represent a roughly two-month supply at current completion rates. Any significant interruption to Bakken drilling activity — whether from a price correction, winter weather disruptions, or capital allocation shifts — would quickly show up in production flat-lines. The basin lacks the DUC cushion that the Permian and gas basins carry.
DUC Wells as a Production Leading Indicator
The decline in the national DUC count from its 2020 peak of ~8,900 to the current range of approximately 4,500–4,600 represents a structural shift in how operators manage their completion pipelines. The COVID-era DUC swell was the product of companies that had committed to multi-year drilling programs suddenly hitting a price and capital wall — they kept drilling (or couldn't stop quickly) but stopped completing wells.
The post-2021 drawdown means the US production base is now more dependent on active drilling and completion activity staying synchronized. There is less of a buffer. In the 2019–2020 framework, a rig count drop of 100 rigs could be partially absorbed by completing DUC inventory — buying 6–12 months before production growth actually stalled. At today's lower DUC counts, that cushion is thinner.
CIR Analysis: at current WTI near $100 and the Permian running approximately 300 rigs, the national DUC count is unlikely to rebuild meaningfully. Operators are completing wells as fast as their service company capacity allows. The DUC count will remain in a tight range unless a sharp price correction causes operators to pause completions while maintaining some drilling activity — the same dynamic that drove the 2020 surge.
What To Watch
- Permian DUC count trajectory: If the Permian DUC count starts rising while rig counts hold steady, it signals completion bottlenecks — either frac crew availability or infrastructure constraints. That would be a directional warning on near-term Permian production growth.
- Haynesville completions acceleration: Watch Expand Energy and Chesapeake-era operator guidance for DUC completion timing tied to LNG cargo commitments. An acceleration in Haynesville completions is a leading indicator of gas supply response ahead of new LNG trains.
- Appalachian pace vs. Henry Hub: If Henry Hub recovers above $3.50/MMBtu, expect Appalachian operators to accelerate DUC completions — the inventory is there to support a production surge within 60–90 days of a price catalyst.
- Eagle Ford and Bakken DUC replenishment: Both basins need active drilling just to maintain production momentum. A rig count decline in either play would show up in production data faster than it would in the Permian.
Related CIR coverage: Permian Basin Rig Count 2026: Weekly Tracker and Production Implications | Haynesville Shale: 2026 Production Outlook and LNG Export Demand | E&P Earnings Tracker 2026: Production Guidance and Operator Scorecards
Crude Intelligence Report is an independent upstream oil and gas intelligence publication. The content in this article is for informational purposes only and does not constitute investment advice, financial advice, or a recommendation to buy or sell any security. Always conduct your own due diligence before making investment decisions. CIR and its contributors may hold positions in companies mentioned; any such positions will be disclosed when known. © 2026 Crude Intelligence Report. All rights reserved.