The 2020 Low Is Two Weeks Away: Inventory Math Forces the Market's Hand on $100+

Macro | Source data: EIA Weekly Petroleum Status Report (week ending May 15, 2026), FRED WTI and Brent daily close series, Reuters coverage of Barclays and Goldman Sachs research notes
The inventory thesis that has been driving the oil market's floor higher all spring is no longer a forward-looking argument. It is now arithmetic. At the draw rate recorded in the week ending May 15, US commercial crude stocks excluding the SPR will reach the lowest level since early 2020 within two weeks. The market is not pricing in a geopolitical premium. It is pricing in a structural reality.
The Numbers Behind the Thesis
EIA data for the week ending May 15, 2026 shows US commercial crude inventories excluding the SPR at 445,013 thousand barrels. One week prior, that figure stood at 452,876 thousand barrels — a draw of 7,863 Mbbl in seven days.
The draw pace has been consistent. Over the four weeks from April 17 to May 15, inventories fell from 465,729 Mbbl to 445,013 Mbbl — a 20,716 Mbbl decline, averaging roughly 5,179 Mbbl per week. The most recent week accelerated that pace significantly.
The 2020 inventory trough — the lowest commercial crude stocks recorded in the modern EIA series — was 428,106 thousand barrels, recorded in the week of January 17, 2020. Current stocks sit 16,907 Mbbl above that level. At an average of the prior four-week draw pace, that gap closes in approximately three weeks. At last week's single-week pace, two weeks.
This is what Barclays analysts meant when they cited US inventories "within reach of the lowest levels since 2020" in their note maintaining the $100 per barrel Brent forecast, as reported by Reuters. The bank did not flag upside price risk as a speculative overlay — it flagged it as a supply-math conclusion.
Goldman's 6-8 MMbpd Framing
Goldman Sachs published parallel research confirming a 6-8 million barrel per day global supply deficit is drawing at a record pace. The Goldman framing matters because it addresses the counterargument: if WTI has been oscillating between $96 and $98 this week, isn't that evidence the market is capped?
CIR Analysis: No. What this week's price behavior shows is range compression at a higher floor, not a ceiling. WTI fell to $96 briefly on Tuesday following a diplomatic comment from the US-Iran talks. By Friday morning it had recovered to $98.26 — without any new bullish catalyst, purely on skepticism reasserting itself. Each oscillation cycle has ratcheted the floor upward. The Goldman inventory quantification explains why: you cannot sustainably compress price to pre-Hormuz levels when the starting inventory deficit is already this severe. The $96 floor is not a given six weeks from now.
Production Is Not the Offset
US field production for the week ending May 15 was 13,702 thousand barrels per day, per EIA data. That is a robust output level, but it is not expanding fast enough to reverse the inventory trajectory. Refinery net input for the same week was 16,319 Mbpd — domestic demand absorbing substantially more than domestic production is replacing on a stock basis. Export volumes on top of that run rate explain why the weekly draws have been outpacing production growth.
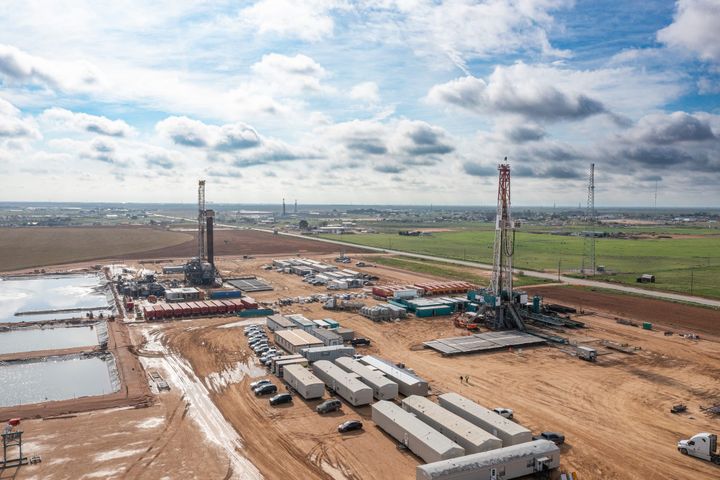
The structural feature operators should internalize: the Permian and other US basins are producing near record volumes and inventories are still declining at an accelerating pace. This is not a production failure story. It is a demand-plus-export story running faster than US upstream can replenish. That is a very different market dynamic than 2023 or 2024.
What $98 WTI Means for Operator Economics
At $98 WTI, the well economics question shifts from "does this well work?" to "how aggressively do we hedge and at what strike?" Operators with hedge books anchored below $85 are watching significant realized-price upside flow to counterparties. Those with open or lightly hedged positions going into Q3 are sitting in the best revenue environment since late 2022.
CIR Analysis: The more operationally relevant question at $98 is service cost. Frac pricing and rig day rates have firmed alongside crude, and the operators most exposed to cost inflation are those with non-operated working interest or mid-tier balance sheets that can't absorb an extended flat rig rate for pipeline capacity. The $100 threshold, if Barclays is correct, probably tightens the cost environment further — particularly in pressure pumping, where the utilization picture heading into H2 2026 has been improving since Q1.
What To Watch
- Next EIA inventory report (May 22 release): Week-ending May 22 data will confirm or break the draw trend. If stocks fall another 6+ MMbbl, the 2020 low becomes a mid-June conversation.
- Iran diplomatic calendar: Any credible Hormuz breakthrough would temporarily pressure WTI toward $92-94, but it would not materially change the underlying inventory deficit without sustained incremental OPEC+ supply — and Saudi spare capacity is not unlimited.
- OPEC+ June meeting (June 1): The alliance will decide on July output levels. A second consecutive production hike of 400-500 Mbpd would begin to address the deficit narrative but would take 6-8 weeks to flow into commercial stocks.
- Refinery utilization heading into peak summer driving season: US refinery runs are at 16.3 MMbpd. If utilization lifts another 2-3% through June, the draw rate accelerates further.
Crude Intelligence Report is an independent upstream oil and gas intelligence publication. The content in this article is for informational purposes only and does not constitute investment advice, financial advice, or a recommendation to buy or sell any security. Always conduct your own due diligence before making investment decisions. CIR and its contributors may hold positions in companies mentioned; any such positions will be disclosed when known. © 2026 Crude Intelligence Report. All rights reserved.
This article contains forward-looking statements and analytical opinions. Actual results may differ materially.