EQT and Expand Energy at Q2 Close: The Gas Divergence Trade Is Working, But Q3 Is the Real Test
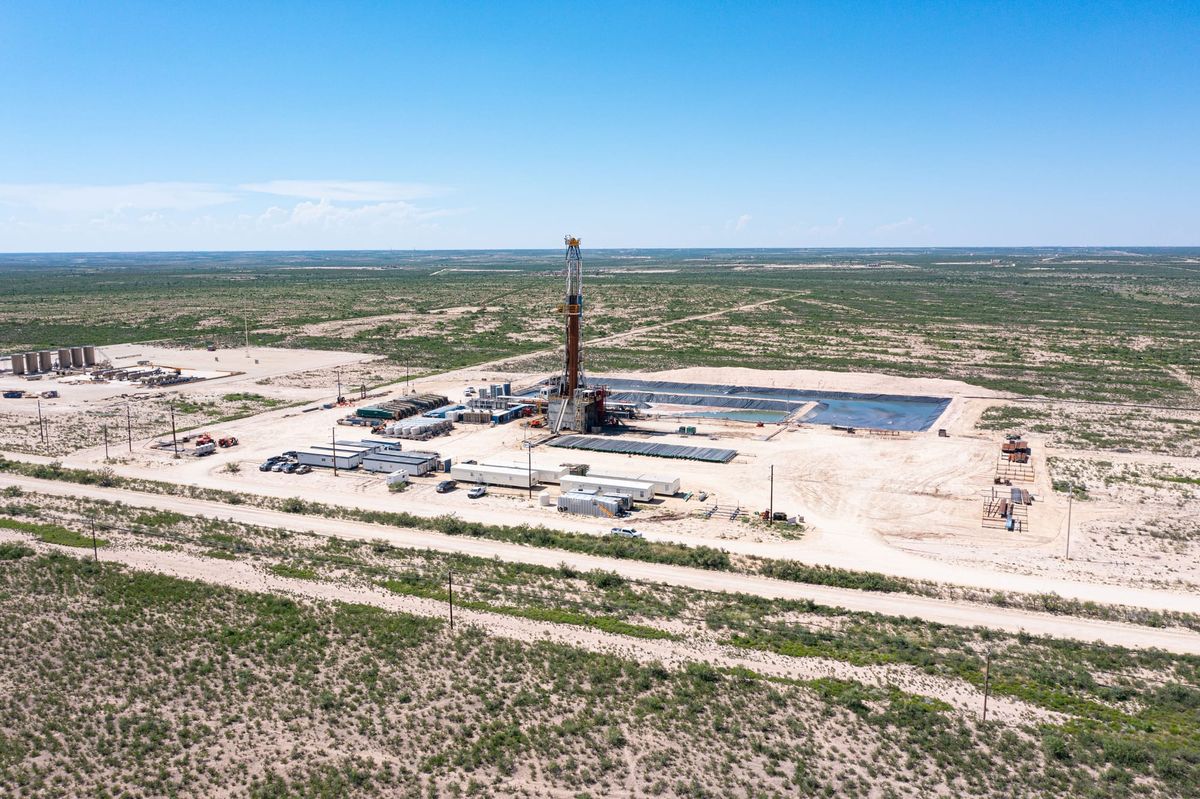
EQT | NASDAQ | EXE | NASDAQ. Source data: EQT Q1 2026 10-Q (EDGAR, filed April 22, 2026); Expand Energy Q1 2026 10-Q (EDGAR, filed April 28, 2026); Yahoo Finance commodity prices, June 30, 2026; EIA natural gas storage series.
WTI closed out Q2 at $70.44 per barrel on Tuesday. Henry Hub closed at $3.30 per MMBtu. The spread between those two numbers is the thesis EQT and Expand Energy (EXE) have been running since Q4 2025: crude weakens as OPEC supply returns, gas holds on structural demand growth, and producers with Haynesville and Appalachian exposure collect a premium the oil-focused names don't. With Q3 opening tomorrow, the question is whether that divergence trade still has legs or whether $3.30 gas is the ceiling before seasonal math softens both stocks.
The short answer: both companies are better positioned for Q3 than the current price deck implies, but neither is insulated from a sub-$3.00 Henry Hub scenario. The hedge books tell different stories. The basin exposure adds another layer of distinction.
Q1 2026: What the Numbers Said
Expand Energy posted total production of 7,436 MMcfe per day in Q1 2026, up 9.5% year-over-year from 6,788 MMcfe/d in Q1 2025. The growth was spread across all three basins: Haynesville at 3,148 MMcf/d (from 2,617), Northeast Appalachia at 2,785 MMcf/d (from 2,668), and Southwest Appalachia contributing the remainder. Average realized price including derivatives came in at $4.35/Mcfe, up from $3.76 in the year-ago quarter. Total natural gas sales of $3,315 million versus $2,300 million a year earlier reflects both Winter Storm Fern volume uplift and a hedge book structured for upside participation. Source: EXE Q1 2026 10-Q, EDGAR.
EQT reported total Q1 2026 sales volumes of 617,699 MMcfe, equivalent to roughly 6.86 Bcfe per day, at an average realized price of $5.08 per Mcfe versus $3.77 in the year-ago quarter. Total upstream adjusted operating revenues reached $3.14 billion. The Appalachian cost structure continues to benefit from Mountain Valley Pipeline capacity, which came into service June 2024 and expanded EQT's access to premium Southeast and mid-Atlantic markets. Source: EQT Q1 2026 10-Q, EDGAR.
Where the Two Companies Diverge on Q3 Risk
EQT's hedge book shows Q3 2026 at 125 MMDth hedged (1.4 MMDth/d) with a three-way collar structure: $3.50 put floor, $4.94 call ceiling, and a $2.50 short put on a portion of the position. At $3.30 spot, EQT sits between its floor and ceiling, meaning hedge income is positive but capped. If gas weakens to $3.00, the collar floor kicks in and limits downside on the hedged portion. EQT also guided Q2 2026 to include 10 to 15 Bcfe of strategic curtailments subject to market conditions. CIR Analysis: that curtailment posture signals willingness to hold volumes off market rather than chase a soft price. Applied to Q3, it means the production guidance number is a ceiling, not a floor. Source: EQT Q1 2026 10-Q hedge table, EDGAR.
EXE's position is structurally different. The company confirmed in its Q1 10-Q that over 65% of projected 2026 gas volumes through year-end are covered by floor price protection via costless collars and three-way collars, with significant upside participation on the unhedged portion. EXE also cited three structural demand tailwinds explicitly in its 10-Q filings: new LNG export capacity, accelerating industrial onshoring, and the rapid expansion of AI-powered data centers. The NG3 gathering pipeline, placed into service October 1, 2025, connects Haynesville production to Gulf Coast markets including LNG export terminals and provides a direct route bypassing Henry Hub basis volatility. Source: EXE Q1 2026 10-Q, EDGAR.
CIR Analysis: EQT and EXE are running different risk profiles for Q3. EQT is managing volume flexibility and collar protection. EXE is running high production volume with a lower hedged percentage but a structurally tighter connection to LNG pricing through NG3 and Gulf Coast transport. At $3.30 Henry Hub, both generate positive free cash flow. At $3.00, EQT's curtailment lever matters more. At $3.50 or above, EXE's upside participation collar structure collects the most incremental value.
The AI Gas Demand Thesis: Commercial vs. Marketing
Both companies reference data center demand in investor communications. The distinction worth tracking is where it shows up in actual contract structure versus where it remains a macro tailwind with no commercial attachment.
EXE's Haynesville position benefits structurally from proximity to Sabine Pass, Calcasieu Pass, and the Commonwealth LNG terminal (which reached FID in May 2026). The NG3 pipeline reduces basis exposure at Henry Hub and tightens the link to LNG cargo pricing. EXE's Q1 average Haynesville realized price of $4.40/Mcf against a Q1 NYMEX average of $5.04 reflects basis and hedge structure. CIR Analysis: the full LNG uplift flows through cash flow rather than the reported realized price line. The gap between those two numbers narrows as LNG offtake capacity expands through 2027.
EQT's data center exposure is indirect but geographically concentrated. MVP Mainline's 2.0 Bcf/d capacity and the MVP Southgate extension (under construction, targeted toward North Carolina) connect Appalachian production to the Southeast corridor, where data center buildout in Virginia, North Carolina, and Georgia places incremental gas-fired power demand within reach of EQT's pipeline grid. CIR Analysis: at current forward curves, the Appalachian basis premium over Henry Hub in the Southeast corridor is narrower than the structural demand case would justify. That gap is a Q4 re-rating story, not a Q3 catalyst. The MVP Southgate timeline and any hyperscaler power procurement announcements in the Southeast are the signals to watch.
What Q3 Requires
For the oil-gas divergence trade to extend through Q3, three conditions need to hold: Henry Hub stays at or above $3.15, storage injection pace runs below the five-year seasonal average through August, and LNG export utilization holds near capacity. EIA weekly data for the week ending June 19 shows South Central underground storage at 1,066 Bcf and East region at 558 Bcf. Whether those numbers run above or below the five-year average through summer is the controlling variable for Q3 realized prices at both companies. Source: EIA weekly natural gas storage series.
What To Watch in Q3:
- EIA weekly storage reports through July and August: injection pace versus the five-year average is the most direct read on Q3 Henry Hub direction
- Commonwealth LNG ramp schedule: any timeline update for first cargo signals Haynesville volume pull, directly relevant to EXE Haynesville basis
- EQT Q2 curtailment disclosure: if actual Q2 curtailments exceed the 10 to 15 Bcfe guidance range, it signals management read on Q3 as softer than consensus
- EXE controller search: Greg Larson's June 23 resignation as VP Accounting (8-K, EDGAR) is not operationally material but warrants monitoring if the permanent replacement takes more than one quarter
Disclosure: The author/publisher holds positions in EQT and EXE as of the publication date. This does not constitute investment advice.
Crude Intelligence Report is an independent upstream oil and gas intelligence publication. The content in this article is for informational purposes only and does not constitute investment advice, financial advice, or a recommendation to buy or sell any security. Always conduct your own due diligence before making investment decisions. CIR and its contributors may hold positions in companies mentioned; any such positions will be disclosed when known. © 2026 Crude Intelligence Report. All rights reserved.
This article contains forward-looking statements and analytical opinions. Actual results may differ materially.