Chord Energy at $75 WTI: Integration Delivered, Now Comes the Price Test (CHRD)
CHRD | NASDAQ | Source data: Q1 2026 10-Q (SEC accession 0001486159-26-000023, filed May 7, 2026), Yahoo Finance intraday price data
The Integration Delivered. Now Comes the Price Test.
Chord Energy closed out Q1 2026 with its Williston Basin consolidation fully absorbed and the production machine humming: 275,615 boepd, $507.5 million in operating cash flow, and $2.19 billion in liquidity. Then WTI hit $95+ on Middle East disruptions, and everyone looked like a genius. That's over. WTI is trading at $75.54 today. The question is whether the integrated cost structure can generate free cash flow at prices that are now 20% below where they were when the quarter ended.
What the Integration Actually Delivered
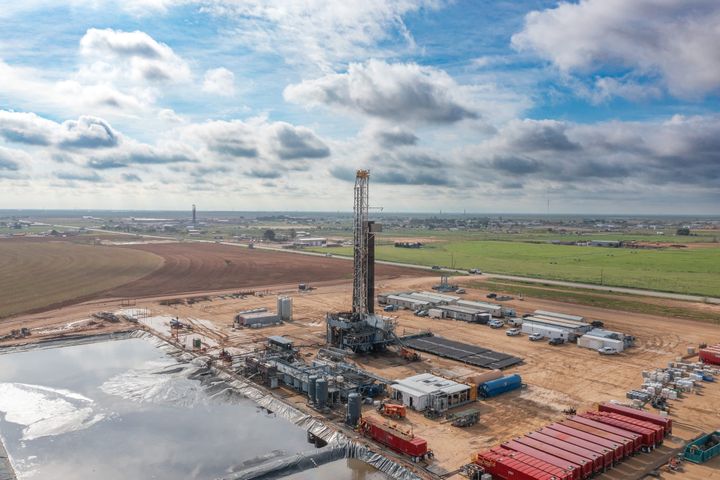
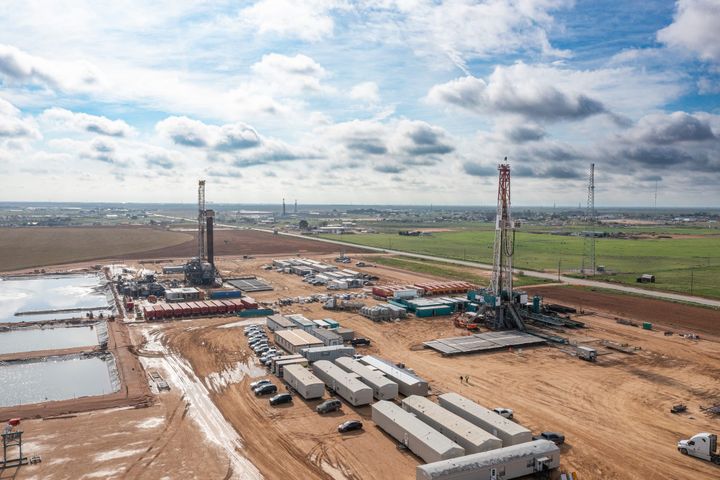
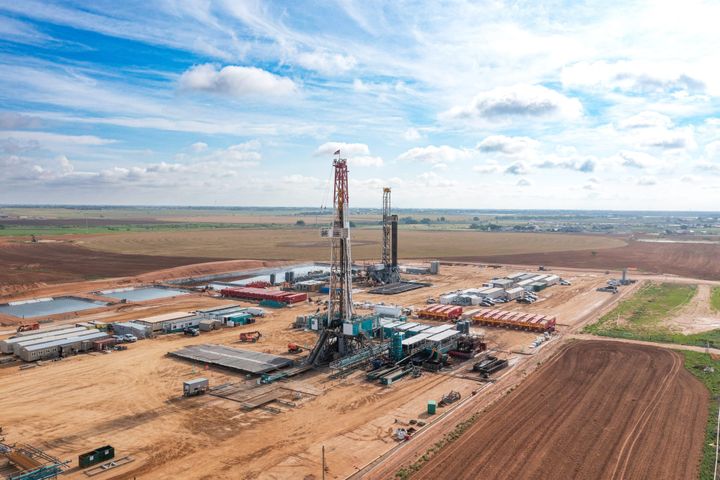
Chord completed its Williston Basin consolidation in July 2024, creating the largest independent Williston Basin operator. Q1 2026 is now nearly two years into running the combined entity, and the 10-Q numbers tell a clean story. Average production hit 275,615 boepd (57% oil), up from 270,855 boepd in the year-ago quarter, a 1.8% volume gain on a much larger base. Per Chord's Q1 2026 10-Q, lease operating expenses came in at $9.87/boe, up $0.31/boe year-over-year but still competitive by Williston standards. GPT dropped to $2.70/boe from $3.01/boe a year earlier, a $0.31/boe improvement reflecting the connected gathering infrastructure from the combined position.
Crude oil realized at $70.05/bbl before derivative settlements in Q1 2026, versus $69.11/bbl in the year-ago period. The WTI uplift was marginal; most of Q1 2026's revenue story was about volume and the step-up from Q4 last year's $56.90/bbl realized price when WTI was depressed. Capital expenditures ran $344.9 million in Q1 2026 on a $351.3 million cash basis, right in line with the prior year's pace, which signals Chord isn't over-drilling the combined position.
The depletion rate tells a different story: $15.20/boe in Q1 2026, up $1.11/boe year-over-year. Per the 10-Q, that increase is driven by a decrease in proved developed reserves, meaning the reserve base isn't keeping pace with production at current development rates. That's a long-run flag, not a crisis, but it's the kind of metric that gets harder to ignore when WTI backs off.
The Sub-$80 Scenario
Chord's derivative book at March 31, 2026 shows 5.491 million barrels in fixed-price swaps for 2026 at $69.54/bbl and 7.024 million barrels in two-way collars with a $72.19 floor and $81.92 ceiling. At today's WTI of $75.54, which sits inside the collar floor-ceiling range, Chord is capturing most of the spot price. But $75.54 is not a comfortable number for the unhedged portion of production, and those collars roll off.
CIR Analysis: At $75/WTI, Chord's realized crude price after derivative settlements lands roughly in the $73 to $75 range depending on the basis differential. Against LOE of $9.87/boe, GPT of $2.70/boe, production taxes at 7.5% of revenues, and DD&A at $15.20/boe, the operating economics still work. Total controllable cash costs run approximately $15 to $16/boe before production taxes, well inside the realized price. The breakeven question is really about capital allocation: can Chord sustain $345 million per quarter in capex and still generate meaningful free cash flow at $75 WTI? The math is tight. At $70/bbl realized, operating cash flow dips meaningfully. At $65/bbl, the dividend ($1.30/share base, $74.2 million paid in Q1) and the buyback program ($67.7 million in Q1) get harder to defend simultaneously.
Debt and Liquidity: Better Positioned Than Most
Long-term debt stands at $1.48 billion: $750 million in 6.000% notes due 2030 and $750 million in 6.750% notes due 2033, per the Q1 10-Q. No revolver draw as of March 31, with $1.97 billion of unused credit facility capacity. Borrowing base was reaffirmed at $2.75 billion in May 2026. Cash on hand was $225.8 million. Total liquidity: $2.19 billion.
For a company producing 275,000+ boepd, that debt load is manageable. Net debt-to-EBITDA at Q1 2026 operating income run rates sits well below 1x even at $75 WTI. Chord has the balance sheet to ride out a $70 to $75 WTI environment without a forced response, unlike some Permian peers who leveraged up for acreage in 2024 at peak prices.
The Williston vs. Permian Comparison That Matters
CIR Analysis: Chord is a Williston operator in a world that increasingly prices Permian-first. That matters at $75 WTI. Permian operators running $8 to $10/boe LOE and sub-$12/boe breakevens have more margin cushion than Chord at $9.87/boe LOE. Chord's GPT at $2.70/boe is competitive, and Williston gathering infrastructure is mature. The basin economics are defensible. The ceiling is that Chord doesn't have a Permian card to play for upside if oil prices recover. Its upside is production growth within the Williston position, which is constrained by the depletion rate creeping up.
The peer to watch is Continental Resources, which took the Williston private in 2022 and runs the largest position in the basin. Continental doesn't file publicly, so CIR can't compare balance sheets directly. What operators can assess: if Chord is facing $9.87/boe LOE on an optimized consolidated footprint, anyone running older single-basin Williston acreage without comparable gathering integration is likely worse off at $75 WTI.
What To Watch
- Q2 2026 realized price: Chord's Q2 hedges include three-way collars with a $65.58 floor and $77.65 ceiling on 3.527 million barrels. If WTI stays sub-$77 through Q2, Chord captures most of that range but the ceiling caps the upside. Watch the unrealized derivative loss position, which was $164.6 million at March 31 and will move with the forward curve.
- Depletion rate trajectory: The Q1 2026 rate of $15.20/boe vs. $14.09 in the year-ago quarter needs to stabilize. A continued rise signals the reserve replacement math is getting harder.
- Capital allocation pivot point: At what WTI price does Chord choose buybacks over production growth? At $1.30/share base dividend and 56.3 million shares outstanding, the annual dividend commitment is approximately $293 million. That's the floor. Discretionary capex and buybacks are the variable.
- Borrowing base October redetermination: The next RBL redetermination is October 2026. If WTI stays in the $70 to $75 range, expect the borrowing base to hold but with lender conversations about forward capital discipline. Not a crisis at $2.19 billion liquidity, but a data point to track.
CIR Verdict
The consolidation thesis held up. Chord delivered volume growth, cost discipline, and a clean balance sheet in an environment that tested the thesis immediately after the acquisition closed. The Q1 2026 numbers from the 10-Q are solid. The problem is $75 WTI: it compresses the free cash flow math without breaking it, puts the dividend-and-buyback combination under pressure, and raises the question of how long Chord can sustain $345 million quarterly capex without drawing on the revolver. CIR Analysis: the answer is probably two to three quarters at $75 WTI before management is forced to choose between the dividend, the buyback, or the drill bit. Watch Q2 guidance for signals that decision is already in motion.
Crude Intelligence Report is an independent upstream oil and gas intelligence publication. The content in this article is for informational purposes only and does not constitute investment advice, financial advice, or a recommendation to buy or sell any security. Always conduct your own due diligence before making investment decisions. CIR and its contributors may hold positions in companies mentioned; any such positions will be disclosed when known. © 2026 Crude Intelligence Report. All rights reserved.
This article contains forward-looking statements and analytical opinions. Actual results may differ materially.