State of U.S. Upstream: The 2026 Benchmarking Report
Every quarter, CIR benchmarks U.S. upstream across the metrics that actually matter: production volumes, rig count by basin, year-over-year trajectory, and the macro environment heading into the next period. This is the Q1 2026 edition.
Production: The January Reset
EIA data for January 2026 shows U.S. crude production at 13,246 Mbbl/d — down from 13,656 Mbbl/d in December and 13,789 Mbbl/d in November. The January dip is partly seasonal (fewer producing days, weather-related curtailments) and partly real. The November 2025 peak near 13.8 MMbbl/d likely represented the current cycle high absent a meaningful step-up in drilling activity.
Year-over-year, the U.S. is running roughly 400,000 bbl/d higher than January 2025. That's a 3% growth rate — meaningful, but not the 5-7% growth years of the early shale era. This is mature-basin efficiency driving incremental production, not a new drilling boom.
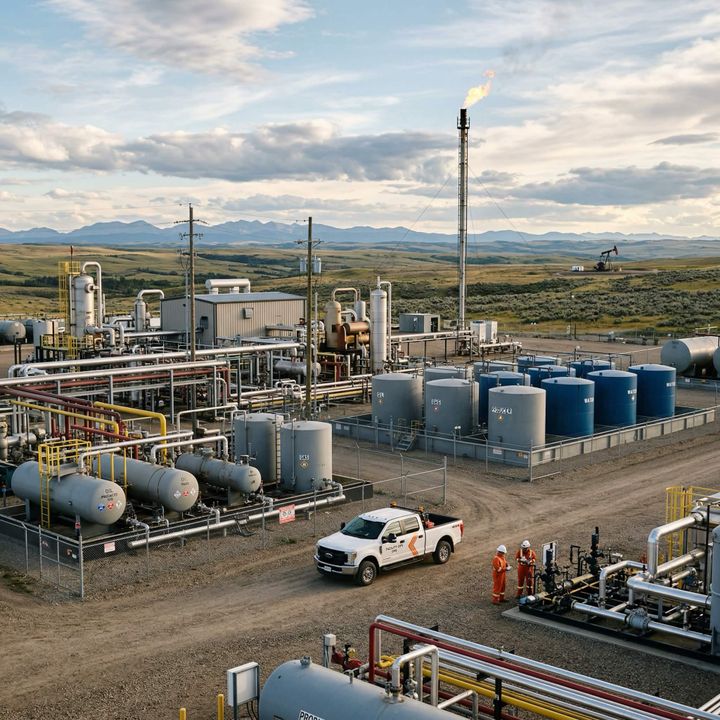
Texas: The Permian Anchor
Texas accounted for 5,570 Mbbl/d in January 2026, representing 42% of total U.S. production. The December 2025 reading of 5,806 Mbbl/d was the recent high. The Permian Basin — straddling West Texas and Southeast New Mexico — dominates this figure, with Midland and Delaware sub-basins both running at scale.
Texas production growth has flattened relative to 2024. The operators adding volume — primarily Diamondback post-Endeavor and ExxonMobil following the Pioneer integration — are doing so from an efficiency base, not a drilling acceleration. The Fletcher/PaceX rigs running across Midland Basin are optimized for long laterals and simulfrac completions, extracting more barrels per rig-day than the industry averaged three years ago.
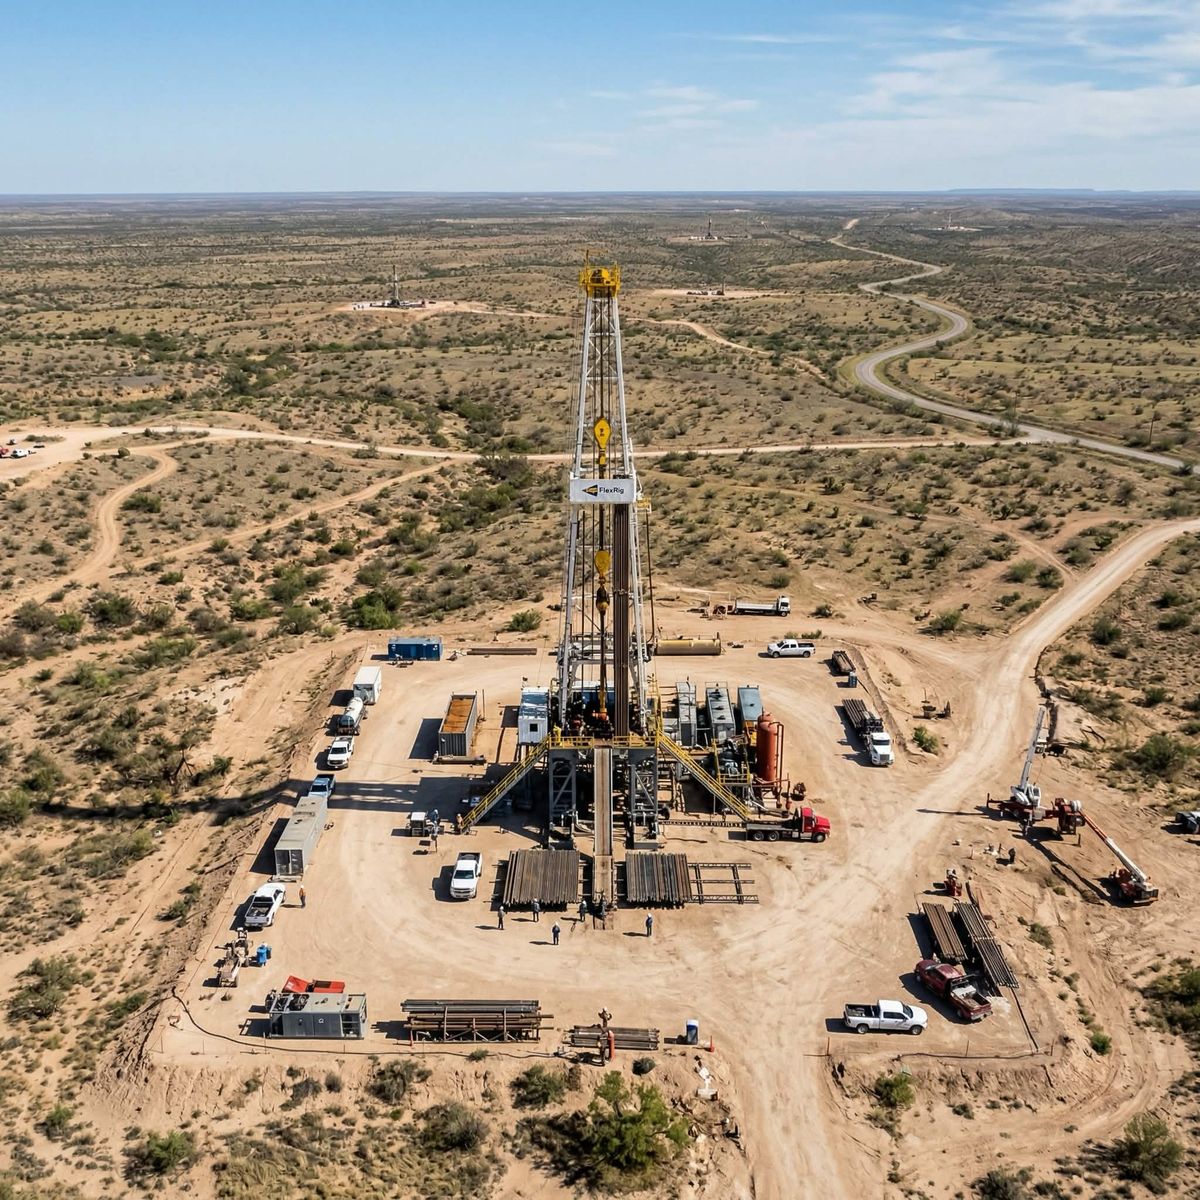
Rig Count: Efficiency Beats Volume
Baker Hughes data through late March 2026 shows the U.S. land rig count at 543 total rigs. Basin breakdown:
- Permian Basin: 241 rigs (44% of total) — Midland and Delaware both active
- Haynesville: 55 rigs — held up by LNG demand pull
- Eagle Ford: 42 rigs — steady but not growing
- Bakken/Williston: 30 rigs — range-bound, no breakout
- Marcellus/Utica: 25 rigs combined — disciplined Appalachian activity
At 543 rigs, the U.S. is running 12% below the 2023 average and roughly 35% below the 2018-2019 peak. The market has structurally reset to a higher-efficiency, lower-intensity operating environment. For context: the U.S. produced roughly 11 MMbbl/d in 2018 with north of 800 rigs. Today it produces 13+ MMbbl/d with 543. The productivity story is extraordinary.
Basin Performance Rankings: Q1 2026
1. Permian Basin — Undisputed leader. Scale, inventory depth, infrastructure build-out, and operator quality create a compounding advantage that widens every year. The post-consolidation landscape (ExxonMobil/Pioneer, Diamondback/Endeavor, ConocoPhillips/CrownRock) is generating operational improvements visible in cost-per-BOE data.
2. Haynesville — Best-positioned gas basin for 2026-2028. LNG contracts, proximity to Sabine Pass and Calcasieu Pass, and a technically demanding reservoir that favors well-capitalized operators. At 55 rigs, it's the gas basin with legitimate demand tailwinds.
3. Eagle Ford — Underrated by the market, consistently productive. Multi-zone stacked pay, improving completion designs, and proximity to Houston refiners. Not growing aggressively, but generating reliable FCF for mid-size operators.
4. Marcellus/Utica — Structurally challenged by takeaway constraints despite world-class rock. The pipeline buildout remains incomplete. Operators like EQT and CNX continue to generate strong returns from existing inventory, but basin-level growth requires infrastructure solutions that aren't fully funded.
5. Bakken/Williston — Mature, steady, uninspiring. At 30 rigs and ~1.1 MMbbl/d, the basin is in managed decline mode. The operators still running hard (Continental, Chord) are doing so from the best inventory. The economic tier below them is thin at current prices.
Macro Setup: Heading Into Q2 2026
WTI has been trading in the $68-$76/bbl range. OPEC+ discipline is the key swing factor — Saudi Arabia needs $85-$90 to balance its fiscal budget, and the cartel has repeatedly demonstrated a willingness to defend price floors. U.S. production growth is moderating. LNG exports are pulling natural gas prices off multi-year lows. The setup into Q2 2026 is stable, not exciting: constructive for disciplined operators, challenging for marginal plays.
Watch the revision cycle. If Q1 2026 production comes in below seasonal expectations when March data prints in May, that's a meaningful signal that decline rates are winning the battle against the efficiency offset. If it holds or surprises high, the productivity story has another chapter.
Crude Intelligence Report is an independent upstream oil and gas intelligence publication. Content is for informational purposes only and does not constitute investment advice, financial advice, or a recommendation to buy or sell any security. Always conduct your own due diligence before making investment decisions. The author and publisher hold no positions in any companies mentioned in this article. © 2026 Crude Intelligence Report. All rights reserved.