Permian Resources Q1 2026: Cost Machine Hits Investment Grade, $513M Free Cash Flow
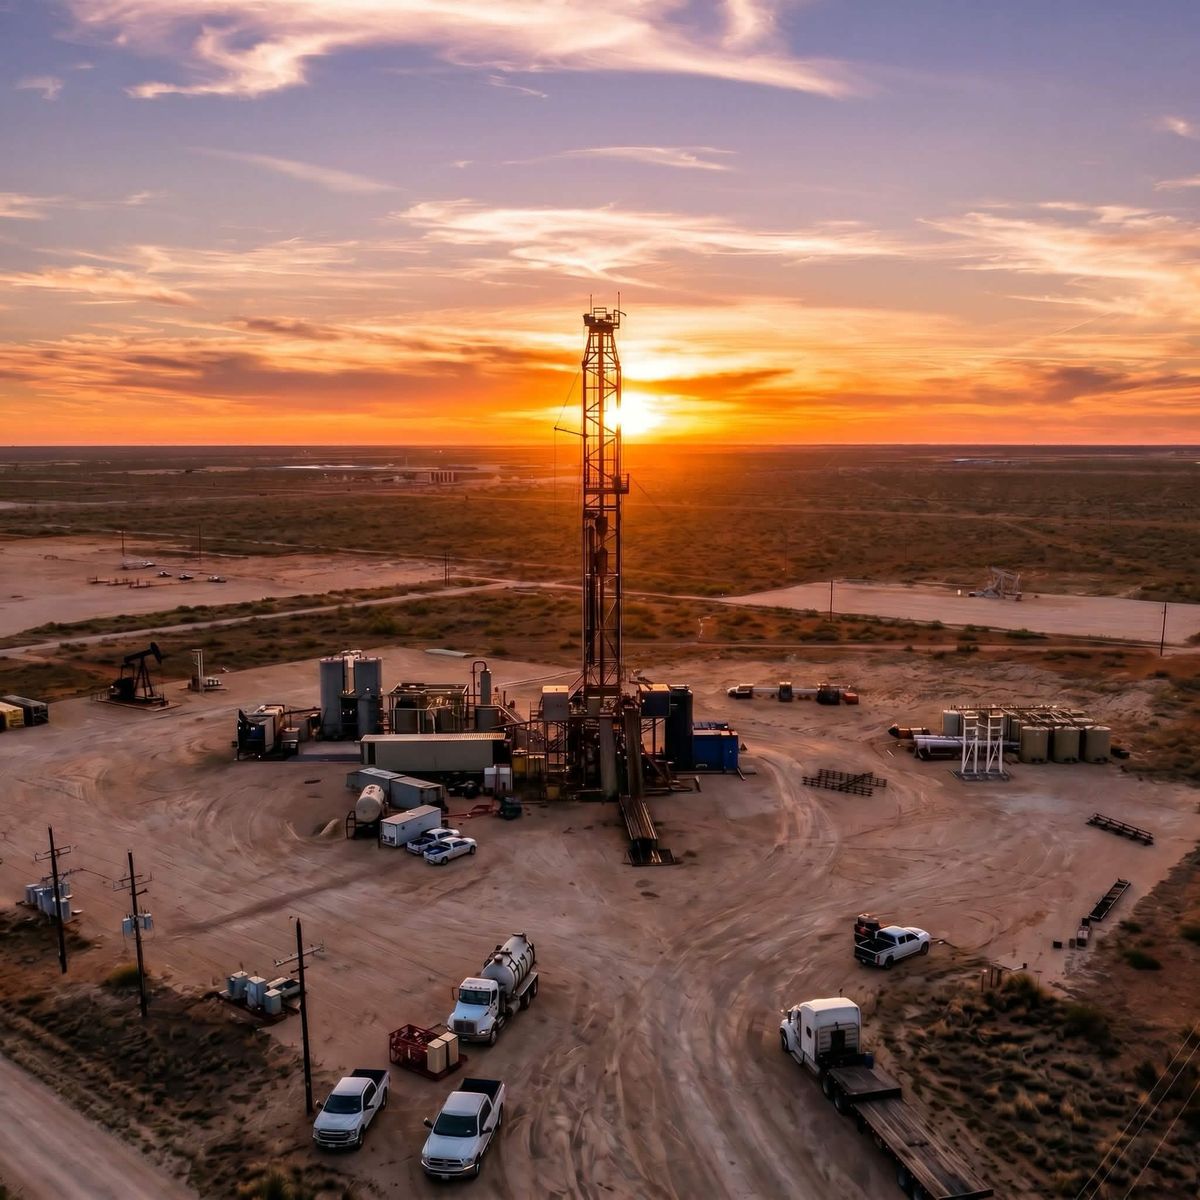
PR | NYSE | Source data: Q1 2026 earnings release, 8-K filed May 6, 2026 (SEC accession 0001658566-26-000069), Q1 2025 10-Q for comparative data
Executive Summary
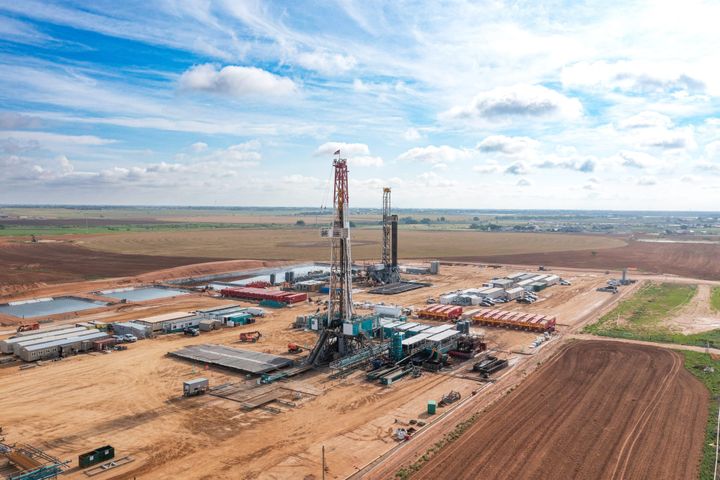
Permian Resources delivered the quarter that validated everything the company has been building toward since the Centennial-Colgate merger closed in 2022. Production hit 412.9 MBoe/d, including 192.3 MBbls/d of oil — a 10% year-over-year volume gain — while drilling and completion costs per lateral foot fell to $685, the lowest in company history and 6% below 2025 results. Adjusted free cash flow came in at $513 million on just $466 million of capital spend. And as of May 2026, Permian Resources carries investment grade ratings from all three major agencies: Fitch (BBB-, July 2025), S&P (BBB-, March 2026), and Moody's (Baa3, April 2026).
That trifecta matters more than it sounds. For a Delaware Basin pure-play that started as a private equity vehicle four years ago and is still working down PE sponsor exposure, investment grade status is the credential that unlocks a different cost-of-capital tier, better credit facility terms, and the institutional shareholder base that comes with it. The new $3.0 billion revolving credit facility — executed April 30, with no security requirement and reduced fees — is the direct payoff.
WTI averaged roughly $72.74/bbl through Q1 2026, an unusual quarter that ranged from below $60 in January to nearly $105 in late March as Middle East tensions escalated. That volatile macro backdrop, and particularly the March crude spike, gave PR's operations team a live test: they responded by accelerating incremental production, pulling forward completions, and posting a 2% QoQ oil growth number that exceeded their own trajectory. Q2 guidance is being set modestly above Q1 on both oil volumes and capex.
CIR Analysis: Permian Resources is executing the cost leadership playbook more cleanly than any other mid-cap Permian pure-play. The $685/ft D&C cost number isn't a soft target — it's a 6% decline YoY and 2% below the prior quarter, on a quarter that also included accelerated workover activity to capture the March price spike. That combination — lower costs, higher volumes, capital flexibility — is a hard act to match at the Delaware Basin's current well depth and completion intensity.
Production Performance
Production came in at 412,850 Boe/d for Q1 2026, up from 373,209 Boe/d in Q1 2025 — a 10.6% year-over-year gain. The oil-specific growth is what matters most: 192,349 Bbls/d vs. 174,967 Bbls/d a year ago, also up roughly 10%.
On a sequential basis, the 2% QoQ oil growth was deliberately engineered. Per the release, the company increased workover activity and took specific steps to accelerate incremental volumes in March as WTI pushed toward $100 and above. That kind of reactive optionality — being able to pull forward production inside a quarter in response to price signals — is a competitive advantage that smaller Delaware operators often can't replicate at scale.
The full-year oil guidance midpoint now stands at 192.5 MBbls/d, raised 3.5 MBbls/d from prior guidance. With Q1 printing at 192.3, the company is effectively executing at the top of the annual range already. The raises are incremental and measured, not aggressive — which fits the "maximum flexibility" framing both co-CEOs stressed in their remarks.
- Q1 2026: 192.3 MBbls/d oil | 103.3 MBbls/d NGLs | 703.0 MMcf/d natural gas | 412.9 MBoe/d total
- Q1 2025: 175.0 MBbls/d oil | 86.0 MBbls/d NGLs | 673.4 MMcf/d natural gas | 373.2 MBoe/d total
- YoY change: +10.0% oil | +20.1% NGLs | +4.4% natural gas | +10.6% total
Source: Permian Resources Q1 2026 earnings release, 8-K filed May 6, 2026.
The NGL growth (+20% YoY) is partially a function of the Earthstone acreage additions that closed in late 2023 — richer Bone Spring intervals that carry higher liquids content. The gas volume trajectory is worth watching: PR exited Q1 at 703 MMcf/d, and with Waha spot prices having spent significant time at or below zero in early 2026, the company's natural gas transportation strategy is critical to whether that volume translates to revenue.
Commodity Realizations
Sidebar: The Waha Problem and How PR Is Solving It
Waha Hub, located in the Permian Basin's Pecos County, is the pricing point for the vast majority of West Texas natural gas. Because Permian gas production has historically outpaced takeaway capacity — and because associated gas from Permian oil wells flows regardless of gas price — Waha routinely trades at a steep discount to NYMEX Henry Hub. In periods of capacity constraint, Waha spot can go negative: producers must pay someone to take the gas rather than curtail oil production. Henry Hub averaged $4.71/MMBtu in Q1 2026 per FRED data; Waha spot spent meaningful time well below zero.
Permian Resources reported an unhedged realized natural gas price of negative $0.29/Mcf for Q1 2026 — that's the raw Waha exposure. Their active hedging program lifted that to positive $1.33/Mcf (hedge settlements added $1.23/Mcf), plus $0.39/Mcf from purchased gas sales. The end result: a $2.44/Mcf premium to Waha pricing, turning a negative physical price into a modest positive realization.
That's not magic — it's a carefully constructed hedge book. PR currently holds natural gas swaps at Henry Hub through 2027, Waha-specific swaps, and HSC (Houston Ship Channel) basis positions that route exposure away from the depressed West Texas market. By 2027, the company projects over 700 MMcf/d of capacity exposed to Gulf Coast and DFW markets, which structurally shifts their gas realization basis north.
On crude: PR received $70.91/bbl (unhedged) in Q1 2026 against a quarter that averaged roughly $72.74/bbl WTI per FRED. The $1.83/bbl realized discount to benchmark reflects Midland-Cushing basis. Hedge settlements moved realizations to $68.10/bbl including hedges, as the company was short WTI at around $67-$69/bbl when the back-end of Q1 ran hard into the $100+ range.
CIR Analysis: The hedge book cost PR roughly $2.81/bbl on oil in a quarter where WTI ran from the mid-$60s to $104. That's the friction of running a serious hedge program when spot surges. The offsetting benefit: a $2.44/Mcf premium to Waha on gas realizations, turning what would have been negative gas revenue into a modest positive. The trade-off was structurally appropriate for a company that just achieved investment grade and prioritizes balance sheet stability over commodity optionality.
Financial Scorecard
Revenue, costs, and cash generation all moved in the right direction relative to Q1 2025.
- Total oil and gas revenue: $1,388M (Q1 2026) vs. $1,376M (Q1 2025)
- Net income attributable to Class A: $43.6M vs. $329.3M in Q1 2025
- Adjusted net income: $336.6M vs. $360.8M in Q1 2025 (adjusted diluted EPS: $0.39 vs. $0.43)
- Adjusted EBITDAX: $1,047.7M vs. $1,045.0M in Q1 2025
- Adjusted operating cash flow: $979.0M vs. $960.5M in Q1 2025
- Adjusted free cash flow: $512.7M vs. $459.8M in Q1 2025
Source: Permian Resources Q1 2026 earnings release; all GAAP and non-GAAP reconciliations per company disclosure.
The GAAP net income drop from $329M to $44M looks alarming until you look at the derivatives line: a $369M non-cash derivative loss in Q1 2026 (the mark-to-market swing on the hedge book as WTI ripped higher) vs. a $36M gain a year ago. Adjusted EBITDAX, which strips that out, was essentially flat year-over-year at ~$1.05 billion — a solid result given the volatile commodity backdrop.
The cash flow picture is cleaner. Operating cash flow came in at $815M; adjusted operating cash flow (removing working capital timing) at $979M; adjusted FCF after capex at $513M. That's on $466M of drilling and development spend — a 1.1x coverage ratio that leaves room for the bolt-on acquisition program, the debt repayment cadence, and the $0.16/share quarterly dividend.
Balance sheet: Total debt stands at $3.575 billion with cash of $171M, giving net debt of $3.4 billion and a leverage ratio of 0.8x LQA EBITDAX. That's best-in-class for a company this size. Since year-end 2024, PR has reduced total debt by roughly $1.2 billion, including the $550M Earthstone 8.00% Senior Note redemption in April. The new $3.0B revolving credit facility, unsecured and carrying better covenant terms, replaces the prior $2.5B facility.
Structural Simplification and Capital Allocation
Two Q1 developments that deserve specific attention:
C-Corp conversion: During Q1, Permian Resources completed the elimination of its Class C/noncontrolling interest structure. All remaining Class C shareholders converted to Class A. The company is now a plain C-Corp with a single share class — no more partnership economics, no more up-C complexity, no more tax distribution math. This was a drag on institutional ownership and a source of valuation discount versus simpler-structure Permian peers. It's gone.
Sponsor exit: Since 2023, PE sponsors have distributed or monetized over 300 million shares, reducing combined disclosed sponsor ownership from approximately 45% to zero. A Permian E&P with zero institutional PE overhang is a structurally different animal than one with 30-40% of the float sitting in hands that may need to return capital to LPs at inopportune times.
Bolt-on program: The company executed ~40 transactions for $205M during Q1, consistent with the ground-game acquisition strategy that built the ~500,000 net acre Delaware Basin position over the last three years. These aren't transformational deals — they're acreage consolidations, mineral rights, and working interest additions that extend the inventory runway without changing the development program.
CIR Analysis: The structural cleanup — C-Corp conversion, PE sponsor exit, investment grade ratings, unsecured revolver — is not just financial housekeeping. It materially changes who can own this stock. Index funds, sovereign wealth vehicles, and investment grade-mandated fixed-income buyers all require one or more of those boxes to be checked. PR has now checked all of them in a single quarter. The stock's valuation re-rating relative to peers may lag operations by several quarters, but the preconditions for it are now in place.
What Competitors Should Know
Permian Resources' Q1 results are a calibration point for every operator benchmarking Delaware Basin economics in 2026.
The $685/ft D&C cost is the number to compare against. Diamondback reported Q1 cash operating costs at $12.50/boe with comparable efficiency metrics; Devon's closing quarter as an independent entity showed comparable Delaware Basin cost improvement. PR is drilling roughly 11,000-foot average lateral wells — consistent with the industry trend toward longer laterals that amortize fixed completion costs across more productive feet.
The natural gas transportation infrastructure build-out is a competitive differentiator that smaller Delaware operators lack. The Waha basis problem isn't going away — the basin's associated gas production is still growing faster than takeaway capacity in certain corridors — but PR's contracted Gulf Coast and DFW exposure effectively hedges out that risk on a growing percentage of its gas volumes by 2027.
For OFS companies tracking Delaware completion activity: PR guided Q2 capex modestly above Q1's $466M, with a slightly higher rig and completion crew count. ~250 gross TILs for the full year implies a steady-state completion program running roughly 60-65 wells per quarter. That's a durable demand signal for Permian-focused frac and completions companies.
Outlook and Hedging Position
Full-year 2026 guidance (revised):
- Total production: 400,000 - 430,000 Boe/d
- Oil production: 190,000 - 195,000 Bbls/d (midpoint 192.5)
- Total controllable cash costs: $7.15 - $8.15/Boe
- LOE: ~$5.45/Boe | GP&T: ~$1.40/Boe | Cash G&A: ~$0.80/Boe
- Total capex program: $1,750M - $1,950M
- Gross TILs: ~250 at ~75-80% working interest, ~11,000-foot average lateral
Source: Permian Resources revised 2026 guidance, 8-K filed May 6, 2026.
The H2 2026 flexibility language is notable. PR is explicitly telling the market it can run either direction: stay at current pace if oil holds, or cut rigs and completion crews to preserve FCF if macro weakens. With 70,000 Bbls/d hedged at $67-$69 through the end of 2026 and another 10,000 Bbls/d in 2027, the downside protection is real — but so is the upside truncation if WTI stays above $90.
Natural gas hedge position: PR holds Henry Hub and HSC swaps through 2027-2028, supplemented by Waha-specific basis contracts. The Q2 2026 Waha swaps are booked at $0.43/MMBtu — modest, but any positive number is a win given where Waha spot has traded in 2026. The 2027 position at $3.57 Henry Hub with $0.47 Waha basis discount reflects improving confidence in takeaway expansion.
CIR Verdict
Permian Resources delivered everything the bull thesis promised in Q1 2026. Record-low D&C costs. Oil production ahead of guidance. $513M in free cash flow. Investment grade from all three agencies. A cleaner corporate structure than at any point since the company's formation. And a balance sheet sitting at 0.8x leverage with a new unsecured $3B revolver.
The risk factors are real but manageable: Waha basis remains a structural headwind on gas economics (active hedging is a cost-of-carry, not a free fix); the derivative book is short WTI at prices well below where the market has been running; and the Q2 acceleration of activity slightly increases capital intensity at a time when $70+ Waha swaps and sub-$69 crude hedges mean not all of the macro upside flows through.
CIR Analysis: The strategic story here is the transition from "PE-owned, discount-rated Delaware consolidator" to "investment grade, single-share-class, institutionally owned Permian pure-play." That transition compresses the valuation discount that has followed PR since inception. The operations have been excellent for six consecutive quarters. The financial structure has now caught up. Stage 3 of the equity re-rating thesis — institutional re-ownership at full valuation — is the variable that the operations team can't directly control, but has done everything to set up.
What To Watch:
- Waha basis trajectory in Q2 — any further deterioration increases pressure on gas realizations even with hedges
- H2 2026 rig/completion crew decision (will be communicated at Q2 earnings or in an 8-K if macro shifts materially)
- Whether the $1.2B of debt reduction achieved since year-end 2024 continues, or whether bolt-on acquisitions absorb FCF
- S&P/Moody's rating trajectory — BBB- and Baa3 are floor investment grade; upgrade to BBB/Baa2 would further reduce borrowing costs
Data Tables Summary
Production (MBoe/d and component breakdown)
- Q1 2026 total: 412.9 MBoe/d | Oil: 192.3 | NGLs: 103.3 | Gas: 117.2 (703 MMcf/d ÷ 6)
- Q1 2025 total: 373.2 MBoe/d | Oil: 175.0 | NGLs: 86.0 | Gas: 112.2 (673 MMcf/d ÷ 6)
- YoY: +10.6% total | +10.0% oil | +20.1% NGLs | +4.4% gas
Financial Summary
- Revenue Q1 2026: $1,388M | Q1 2025: $1,376M | YoY: +0.8%
- Adjusted EBITDAX Q1 2026: $1,047.7M | Q1 2025: $1,045.0M
- Adjusted FCF Q1 2026: $512.7M | Q1 2025: $459.8M | YoY: +11.5%
- Total debt: $3,575M | Net debt: $3,404M | Leverage: 0.8x LQA EBITDAX
D&C Costs
- Q1 2026: ~$685/lateral foot | Q4 2025 (implied): ~$699/ft | FY2025: ~$730/ft
- YoY reduction: ~6%
Hedge Position (Crude Oil, as of April 30, 2026)
- Q2 2026: 80,000 Bbls/d at $67.43 WTI swap
- Q3 2026: 70,000 Bbls/d at $68.68 WTI swap
- Q4 2026: 70,000 Bbls/d at $67.10 WTI swap
Source: Permian Resources 8-K filed May 6, 2026 (earnings release and hedge tables).
Crude Intelligence Report is an independent upstream oil and gas intelligence publication. The content in this article is for informational purposes only and does not constitute investment advice, financial advice, or a recommendation to buy or sell any security. Always conduct your own due diligence before making investment decisions. CIR and its contributors may hold positions in companies mentioned; any such positions will be disclosed when known. © 2026 Crude Intelligence Report. All rights reserved.
This article contains forward-looking statements and analytical opinions. Actual results may differ materially.