Matador Resources Q1 2026 Earnings Deep Dive: Capital Discipline, Waha Headwinds, and the Hugh Brinson Catalyst
Matador Resources Company (NYSE: MTDR) delivered a dividend declaration on April 22, 2026 — the same date as the company's expected Q1 2026 earnings report — but the formal Q1 2026 earnings press release had not been filed with the SEC as of this writing. Matador announced a quarterly cash dividend of $0.375 per share, payable June 5, 2026 to shareholders of record as of May 8, 2026, per its April 22, 2026 SEC filing. This CIR deep dive synthesizes what the company guided for Q1 2026 in its Q4 2025 earnings release (February 24, 2026), contextualizes the quarter against broader Delaware Basin conditions, and sets out what peers, vendors, and OFS companies should be watching when the full Q1 results arrive.
Setting the Scene: What Matador Guided for Q1 2026
According to Matador's Q4 2025 and Full Year 2025 earnings press release (SEC Form 8-K, filed February 24, 2026), the company entered 2026 with a deliberately front-loaded capital program. Management guided Q1 2026 total production of 201,000 to 205,000 BOE/d, of which approximately 115,500 to 117,500 Bbl/d would be oil — a notable sequential step-down from the record Q4 2025 production of 211,290 BOE/d (121,363 Bbl/d oil).
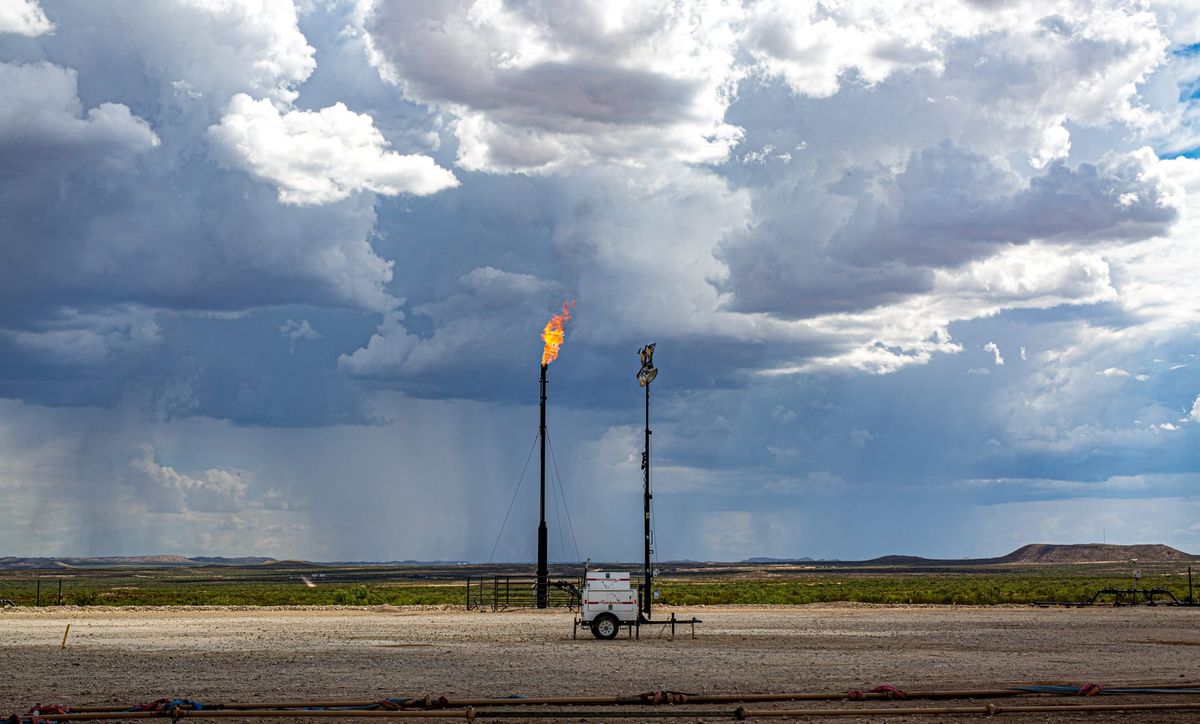
According to the February 2026 press release, Matador flagged three specific headwinds driving Q1 lower: (1) weather-related shut-in volumes during January's Winter Storm Fern of approximately 4,000 BOE/d (60% oil); (2) elective shut-ins due to weak Waha hub natural gas pricing of approximately 3,000 BOE/d (20% oil); and (3) scheduled third-party treatment plant maintenance of approximately 2,000 BOE/d (60% oil).
In total, these factors represented roughly 9,000 BOE/d of anticipated lost production — and explain why Q1 was always expected to be the softest quarter of 2026 before a "significant increase" in Q2 and beyond.
Production vs Guidance: The Back-End Load Strategy
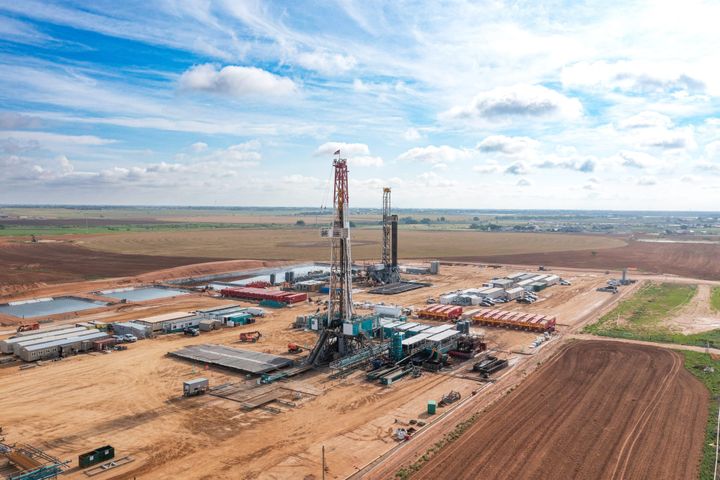
According to Matador's February 2026 guidance, Q1 2026 was intentionally light on well completions, with the bulk of new volumes expected to hit in March and Q2. The company guided approximately 39 gross (34 net) operated wells to be turned to sales during Q1 2026 — but critically, only 11 net operated wells were expected to be turned to sales by mid-February. The remaining 23 net operated wells were scheduled for March, meaning their full production impact would not be felt until Q2 2026.
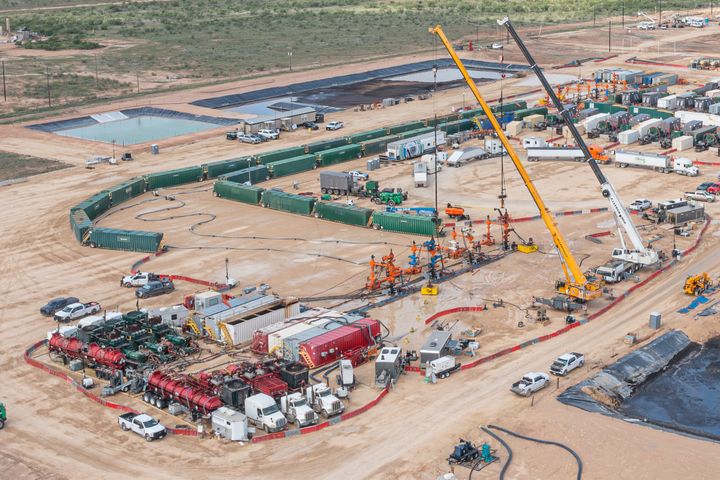
This back-end loading reflects Matador's evolving strategy toward large-scale batch developments — a hallmark of modern Delaware Basin efficiency. According to the company's guidance, batch developments are expected to account for approximately 50% of 2026 net lateral footage turned to sales, up from 40% in 2025. A signature example is the 13-well Eastern Antelope Ridge batch — including Matador's first 3.4-mile lateral wells — expected to turn to sales in the first half of 2026.
CIR Analysis: The Q1 production dip is a feature, not a bug. Matador deliberately pulled 30.4 net wells forward from Q1 into Q4 2025, and the batch development cadence means Q2–Q4 2026 should show substantially stronger volumes. Investors watching sequential production without this context will misread the quarter.
Capital Expenditure: Front-Loaded but Under Control
According to Matador's February 2026 guidance, the company expected approximately $425 million of total D/C/E and midstream CapEx in Q1 2026 alone — representing 55–60% of the full-year 2026 guidance of $1.45–1.55 billion. This concentration reflects the large batch completions and longer laterals being executed in the period.
For the full year, Matador guided total D/C/E CapEx of $1.35–1.44 billion and midstream CapEx of $100–110 million, versus $1.53 billion and $167.9 million in 2025, respectively. That's an 11% reduction in total capital spending year-over-year — while guiding 3% oil production growth to 122,000–124,000 Bbl/d.
According to company guidance, the efficiency improvements driving this capital reduction include a 13% reduction in average well cycle times and a targeted D&C cost of $785–805 per lateral foot, down 6% from 2025 levels. Average lateral length is expected to increase approximately 10% year-over-year as Matador pushes further into 3.4-mile well territory.
CIR Analysis: A $130 million D/C/E reduction alongside positive production growth is genuinely strong capital efficiency. If Matador executes to plan, its 2026 free cash flow profile improves materially versus 2025 — at current WTI near $93/Bbl, the FCF math looks strong — though 50% of production is capped at $66/Bbl via collars, partially limiting the upside capture.
Realized Prices: The Waha Problem Persists into Q1
According to Matador's Q4 2025 financial summary, the company realized oil at $58.89/Bbl (without derivatives) in Q4 — down from $64.91 in Q3 and $70.66 in Q4 2024. Natural gas realizations dropped sharply to $0.91/Mcf in Q4 2025, reflecting persistent Waha hub weakness, before recovering slightly to $1.08/Mcf with derivatives.
The natural gas pricing challenge looms large for Q1 2026 as well. According to Matador's February 2026 guidance commentary, the company continued to face weak Waha pricing in early 2026 and elected to shut in some volumes rather than sell at distressed prices. This is rational economics but depresses near-term revenue.
The longer-term catalyst is significant. According to Matador, the company has secured 500 MMBtu/d of firm transportation on Energy Transfer's Hugh Brinson Pipeline, expected to begin flowing gas in Q3 2026 and reach full service in Q4 2026. This pipeline will provide direct access from the Waha hub to Henry Hub-linked Gulf Coast markets. During 2025, Henry Hub averaged as much as $3/MMBtu higher than Waha. Matador noted that each $0.50/MMBtu improvement in realized natural gas price translates to approximately $90 million in annual incremental revenue.
CIR Analysis: The Hugh Brinson pipeline is one of the most impactful near-term operational catalysts for any mid-cap Permian E&P. By H2 2026, Matador's gas realization profile should look materially different. This is not priced in by most observers focused on near-term Waha weakness.
Debt Refinancing: A Material Balance Sheet Move
One development not captured in the February earnings release deserves specific attention. On February 26, 2026, Matador simultaneously announced a $750 million offering of 6.000% Senior Notes due 2034 and a cash tender offer to retire its outstanding 6.875% Senior Notes due 2028. According to the March 5, 2026 tender offer results filing, approximately 84% of the 2028 notes ($419.7 million of $500 million) were tendered and retired.
The economics of this transaction are straightforward: Matador extended its nearest significant maturity from 2028 to 2034 — a six-year runway extension — while reducing its coupon on the refinanced portion from 6.875% to 6.000%, an 87.5 basis point reduction. On $420 million of refinanced debt, that equates to approximately $3.7 million in annual interest savings. The remaining ~$80 million of 2028 notes not tendered remain outstanding.
CIR Analysis: This refinancing is textbook liability management executed from a position of strength. Matador used the constructive early-2026 credit market environment — before the Iran-driven geopolitical volatility — to push out its maturity wall and cut its cost of debt simultaneously. Investors focused on near-term FCF should note that lower interest expense improves cash flow from operations on a go-forward basis. The 2034 maturity also removes any refinancing overhang from the 2028 notes as a near-term concern. Combined with the 1.1x leverage ratio reported at year-end 2025 and $1.8 billion of RBL liquidity, Matador enters Q1 2026 earnings with a balance sheet that is materially cleaner than it was twelve months ago.
Free Cash Flow: Hedged for Volatility
According to Matador's Q4 2025 press release, the company generated Adjusted Free Cash Flow of $69.0 million in Q4 2025 and $93.4 million in Q3 2025 — both meaningfully below earlier quarters as oil prices declined from 2024 levels. Full-year 2025 FCF was constrained by the post-Ameredev integration and front-loaded spending, but Matador paid down approximately $200 million on its RBL credit facility and ended 2025 with a leverage ratio of 1.1x and $1.8 billion of RBL liquidity.
To protect 2026 FCF in a lower-price environment, Matador disclosed it has hedged approximately 50% of projected 2026 oil production using costless collars with a weighted average floor of approximately $53/Bbl and ceiling of approximately $66/Bbl. These hedges were structured when WTI was trading in the mid-$60s to low-$70s earlier this year. At current WTI prices near $93/Bbl, the picture is inverted: the $66/Bbl ceiling is deeply in-the-money, meaning Matador is capped out of roughly $27/Bbl of upside on 50% of its hedged production. The collars that were designed as downside protection are now acting as an upside cap — a meaningful drag on Q1 realized prices relative to WTI spot.
According to the company, it returned $218.9 million to shareholders in 2025 via $163.1 million in dividends and $55.8 million in buybacks. The $0.375/share quarterly dividend declared for Q1 2026 is consistent with the annualized pace of prior quarters.
2026 Full-Year Guidance: Holding the Line
According to Matador's February 2026 full-year guidance, the company is targeting:
- Oil production: 122,000–124,000 Bbl/d (+3% YoY)
- Natural gas production: 525–545 MMcf/d (+2% YoY)
- Total production: 209,500–215,000 BOE/d (+3% YoY)
- Total operating expenses: $30.00–31.00/BOE (flat YoY)
- D/C/E CapEx: $1.35–1.44 billion (-9% YoY)
- Midstream CapEx: $100–110 million (-37% YoY)
- Combined midstream Adjusted EBITDA (San Mateo + wholly-owned): $360 million (+8% YoY)
CIR Analysis: The 2026 plan is credible on paper. Matador's track record of execution — including Q4 2025 coming in 2% ahead of production guidance — supports confidence. At current WTI near $93/Bbl, Matador's FCF generation should substantially exceed management's February base case. The collar ceiling at $66/Bbl limits upside capture on 50% of hedged production, but the floor at $53/Bbl is irrelevant at current prices. The primary 2026 risk is not oil price — it is Waha: if natural gas hub prices remain suppressed or go negative, gas-side economics will drag against what should otherwise be strong oil-driven margins.
Delaware Basin / Permian Implications
Matador operates approximately 212,500 net acres in the Delaware Basin, concentrated in the Wolfcamp and Bone Spring plays across Southeast New Mexico and West Texas. According to the company, it added 17,500 net acres in 2025 through its "brick-by-brick" land strategy and plans to maintain 10–15 years of high-quality inventory depth.
The Woodford shale test planned for H1 2026 is a notable exploration catalyst — a derisking effort that could expand the inventory stack on existing acreage without incremental land cost. Additionally, Matador is expanding its enhanced completion surfactant program in 2026 following "improved recoveries" in 2025 tests. According to the company, these surfactant completions showed improved production versus control wells over the first 150 days of production in certain formations.
The San Mateo midstream JV (51% Matador / 49% Five Point) is undergoing a strategic review. Five Point is reportedly moving its 49% stake into a continuation vehicle, and Matador disclosed it is evaluating a combination of its wholly-owned midstream assets with San Mateo. If executed, this would create a more consolidated midstream platform with third-party monetization potential — a meaningful value unlock that has been discussed in the market for some time.
What Peers Should Know
For neighboring Delaware Basin operators — particularly Permian Resources, Coterra Energy, and private operators in Eddy and Lea Counties — Matador's Q1 cadence reinforces a few basin-wide themes. First, Waha pricing remains a persistent challenge for any operator with significant gas exposure in the Delaware, and elective curtailments are a rational response when economics don't support production. Second, the move to longer laterals and larger batch developments is accelerating across the basin; operators not yet executing at this scale are falling behind on capital efficiency metrics. Third, the Hugh Brinson pipeline represents new takeaway capacity that will benefit the broader basin's gas marketing optionality when it comes online in H2 2026.
What Vendors and OFS Companies Should Know
Matador's 2026 CapEx reduction — $130 million less in D/C/E spending versus 2025 — is real and reflects genuine efficiency gains, not activity curtailment. According to the company, fewer wells are being drilled per unit of production due to longer laterals and improved cycle times. For oilfield services providers active in the Delaware Basin, this means the volume of activity is roughly flat while the complexity per well increases. Demand for wireline, coiled tubing, and completion equipment will remain steady, but the number of discrete well jobs may decline as batch development concentrates work into larger pads. Midstream-side capital is also contracting sharply — $100–110 million in 2026 versus $167.9 million in 2025 — as the infrastructure buildout following Ameredev matures.
According to Matador's February 2026 guidance commentary, the company is targeting $795 per lateral foot in D&C costs. Vendors with pricing power should note that Matador is actively managing every cost line. Contracts up for renegotiation in 2026 will face pressure to reflect the efficiency gains operators are experiencing.
This article is for informational purposes only and does not constitute investment advice. CIR does not hold positions in the securities mentioned.