Oilfield Services Sector 2026: Pricing Power, Utilization Rates, and What OFS Margins Signal for E&P Activity
The oilfield services sector in 2026 presents a genuine puzzle for upstream analysts: crude oil has spent most of May between $109 and $112 per barrel on FRED settlement data — historically the kind of price environment that drives a sustained OFS upcycle — yet service company margins, utilization rates, and stock prices are running well below what a straightforward commodity rally would suggest. Understanding why that gap exists, and when it closes, is the most useful analytical lens an E&P operator or upstream investor can apply to the current market.
What the Oilfield Services Sector Actually Does
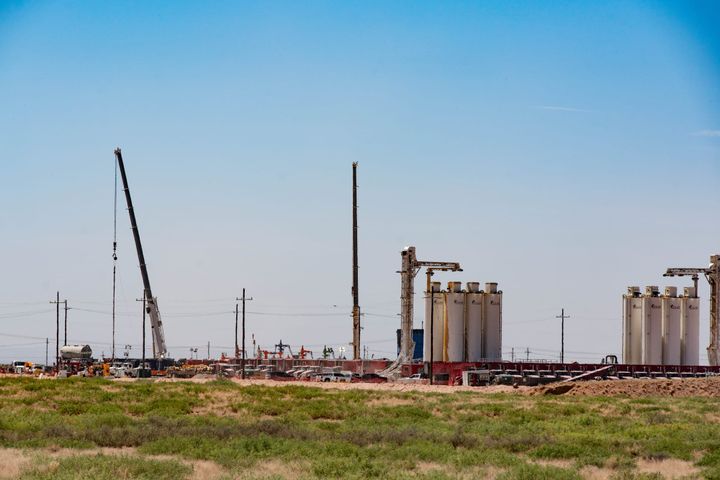
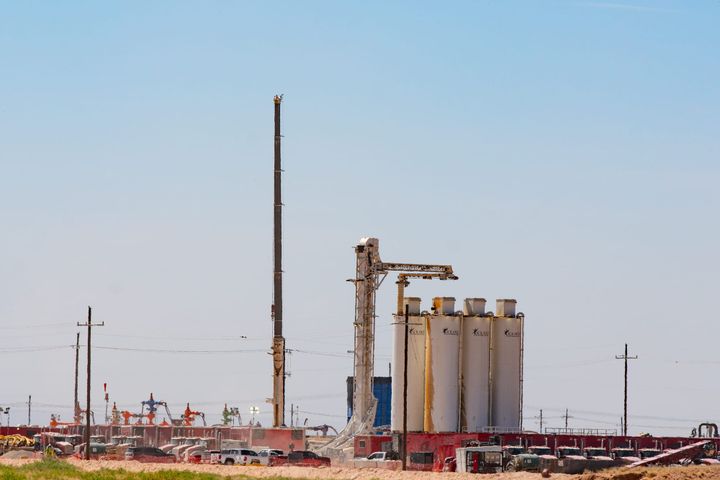
The oilfield services sector provides the specialized equipment, technology, and crews that E&P operators need to drill, complete, and produce oil and gas wells. It spans drilling contractors (Helmerich & Payne, Patterson-UTI, Nabors), pressure pumping and completions (Halliburton, ProPetro, Liberty Energy), wireline and coiled tubing, production services (artificial lift, well intervention, chemicals), and industrial services (Baker Hughes IET, NOV, Forum Energy Technologies). Collectively, the OFS sector functions as the pick-and-shovel layer of the upstream business — it captures activity, not price, as its primary revenue driver.
That distinction matters more in 2026 than it has in years. WTI at $112 doesn't automatically mean more wells. Operators are running disciplined capital programs at current prices, and the rig count signal has been muted: Baker Hughes data tracked through CIR's coverage showed the U.S. total count rising just five units in the week ending May 15 — a modest uptick that confirms operators aren't blinking at geopolitical-driven price spikes, but aren't doubling down either.
The Pricing vs. Utilization Split in the Oilfield Services Sector 2026
The core tension in the oilfield services sector in 2026 is between utilization rates and pricing power. Utilization — the percentage of active capacity deployed — has recovered meaningfully off 2023-2024 lows across drilling and completions. But pricing power, the ability to convert that utilization into margin expansion, has lagged.
Several dynamics are driving the disconnect:
- Operator capital discipline: E&P companies emerging from the 2023-2025 consolidation wave (Devon-Coterra, Ovintiv's NuVista exit, SM Energy's Civitas integration) are managing to free cash flow targets, not activity maximization. That limits incremental demand for OFS capacity even when oil prices are favorable.
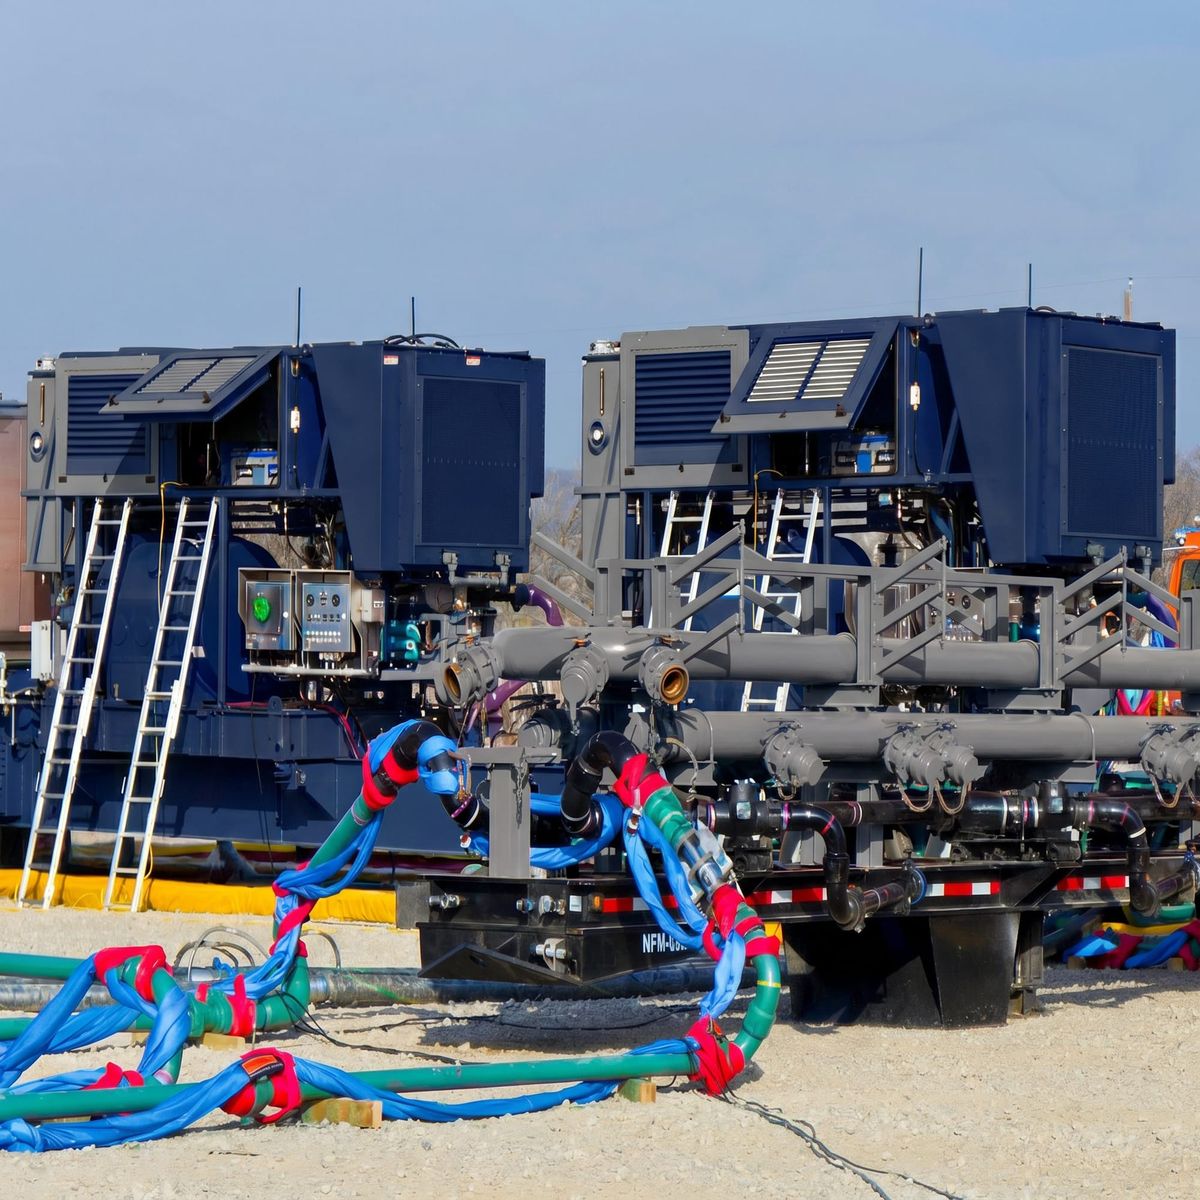
- Overcapacity in land completions: Frac spread availability has been sufficient to keep pumping prices soft. CIR's analysis of the frac market in May found frac pricing wasn't translating into spread gains even at $102 WTI — the market was bid, not squeezed.
- Segment bifurcation: Baker Hughes' Q1 2026 results were emblematic. As CIR reported, BKR's IET segment surged 54% year-over-year on gas turbine and AI data center orders, while OFSE (the traditional oilfield services arm) stagnated. The services company that once defined oilfield services is now driving returns from industrial energy technology.
CIR Analysis: The segment bifurcation at BKR reflects a broader structural shift: services companies with exposure to gas-fired power generation and LNG infrastructure are outperforming their pure oilfield-services peers. This isn't a temporary distortion — it reflects where the decade's incremental capital is flowing.
Where OFS Pricing Power Exists in 2026
Not every segment of the oilfield services sector is facing the same margin pressure. The picture varies significantly by service line:
Drilling contractors (H&P, PTEN, Nabors) have seen modest day-rate improvement on high-specification AC rigs, particularly super-spec FlexRigs operating in the Permian and Eagle Ford. The Q1 E&P earnings sweep — XOM, CVX, Diamondback, Ovintiv, Devon — confirmed sustained completions activity that requires drilling contractor capacity. CIR's read-through on H&P, PTEN, and Nabors found the demand signal present, but contract repricing has been gradual rather than sharp.
Completions and frac are the most contested segment. Halliburton (HAL at $42.28 as of May 20, per Alpha Vantage) has maintained pricing discipline in its North America Completion and Production division, but independent pressure pumpers ProPetro (PUMP, $17.03) are trading near 52-week lows despite the oil price backdrop. The structural headwind is simulfrac adoption and electric fleet overcapacity — both compress unit margins even as calendar utilization looks reasonable.
Production services — artificial lift, well intervention, chemicals — are facing their own margin squeeze. RPC, NOV ($21.16, Alpha Vantage), and ChampionX are running at decent utilization but struggling to expand margins when E&P operators are managing costs tightly. CIR's coverage of production services in May showed RPC's margin squeeze persisting even at $109 WTI, underscoring that price alone isn't the catalyst.
What OFS Margins Signal for E&P Activity
The oilfield services sector functions as a real-time read on upstream confidence. When services companies can push pricing, it means E&P operators are competing for capacity — a signal that activity is at or above available supply. When OFS pricing is soft despite elevated commodity prices, as is the case in the oilfield services sector in 2026, it signals that operators are holding capex flat or letting existing activity run down without replacement.
CIR Analysis: The current OFS setup — utilization recovering, pricing lagging, margins thin — points to a sector in the early innings of repricing rather than a fully-priced upcycle. The catalysts for a steeper OFS margin recovery would be: a sustained rig count increase above 650 nationally, tighter frac spread availability as some of the 2021-2023 vintage equipment retires, or a step-change in natural gas drilling demand driven by LNG FID activity and data center power needs.
Baker Hughes (BKR, $66.79, Alpha Vantage) is already positioned for that LNG-and-data-center thesis. SLB ($57.28) has pivoted its long-cycle international exposure toward Middle East and offshore. The domestic land OFS players remain the most rate-sensitive to U.S. E&P activity levels — and that activity level, not just the commodity price, is the variable that matters most.
What To Watch
- Baker Hughes weekly rig count: A sustained move above 650 U.S. total rigs would be the first clear signal of OFS pricing recovery. Sub-640 means flat-to-down activity.
- HAL and SLB Q2 guidance revisions: If either company narrows pricing ranges upward in Q2 calls, it will be the clearest direct signal that the market is tightening.
- Frac spread count trends: ProFrac, Liberty, and ProPetro active spread counts are a sharper leading indicator than rig count for completions demand.
- Natural gas producer capex: Henry Hub at $3.07 (FRED, May 18) is enough to incentivize Haynesville and Appalachian gas drilling. If gas-directed OFS demand accelerates into H2 2026, it will absorb some of the land services overcapacity that's been suppressing pricing.
Crude Intelligence Report is an independent upstream oil and gas intelligence publication. The content in this article is for informational purposes only and does not constitute investment advice, financial advice, or a recommendation to buy or sell any security. Always conduct your own due diligence before making investment decisions. CIR and its contributors may hold positions in companies mentioned; any such positions will be disclosed when known. © 2026 Crude Intelligence Report. All rights reserved.